Schrödinger Notes—Similarity Search
Declaration
This note is based on the article, “Rapid Screening of Chemical Libraries with GPU Shape”1, and created with the Schrödinger Software Release 2023-4.
This note contains only minimal annotations to the original text, along with corrections to formatting errors. It is intended for educational and communicative purposes only, and all rights remain with the original author.
Introduction
In this tutorial, you will learn how to perform rapid shape-based screening of a chemical library with Shape GPU. We will use information from nearly 70 CDK2 small-molecule inhibitors to evaluate a library of compounds provided by DUD-E for their propensity to bind CDK2 (http://dude.docking.org/). We will then run a screen on GPU using Shape GPU, and perform enrichment calculations using the true actives in the dataset as provided by DUD-E.
1 Creating Projects and Importing Structures
At the start of the session, change the file path to your chosen Working Directory in Maestro to make file navigation easier. Each session in Maestro begins with a default Scratch Project, which is not saved. A Maestro project stores all your data and has a .prj extension. A project may contain numerous entries corresponding to imported structures, as well as the output of modeling-related tasks. Once a project is created, the project is automatically saved each time a change is made.

- Double-click the Maestro icon
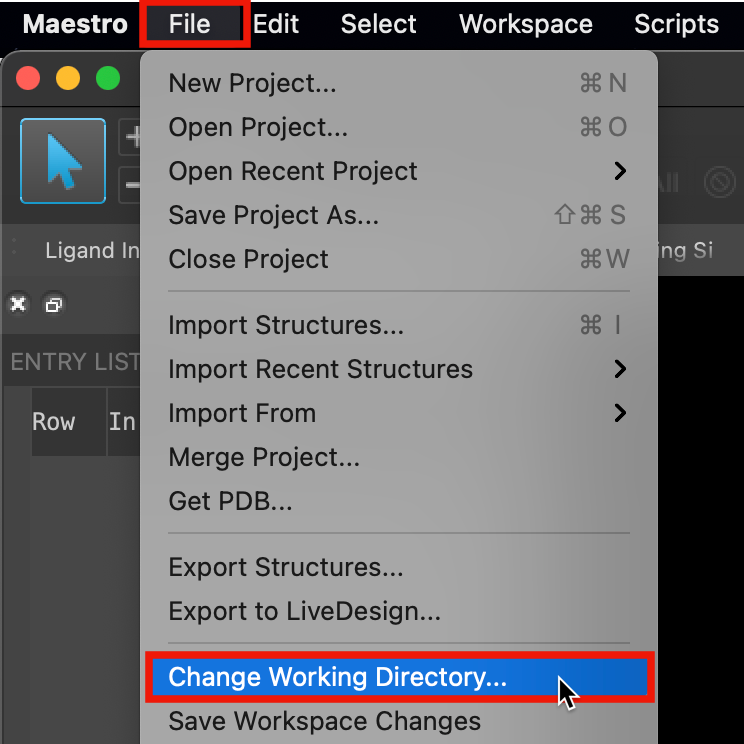
Figure 1-1. Change Working Directory option.
Go to File > Change Working Directory
Find your directory, and click Choose
Pre-generated input and results files are included for running jobs or examining output. Download the zip file here: https://www.schrodinger.com/sites/default/files/s3/release/current/Tutorials/zip/gpu_shape.zip
After downloading the zip file, unzip the contents in your Working Directorythe location that files are saved for ease of access throughout the tutorial
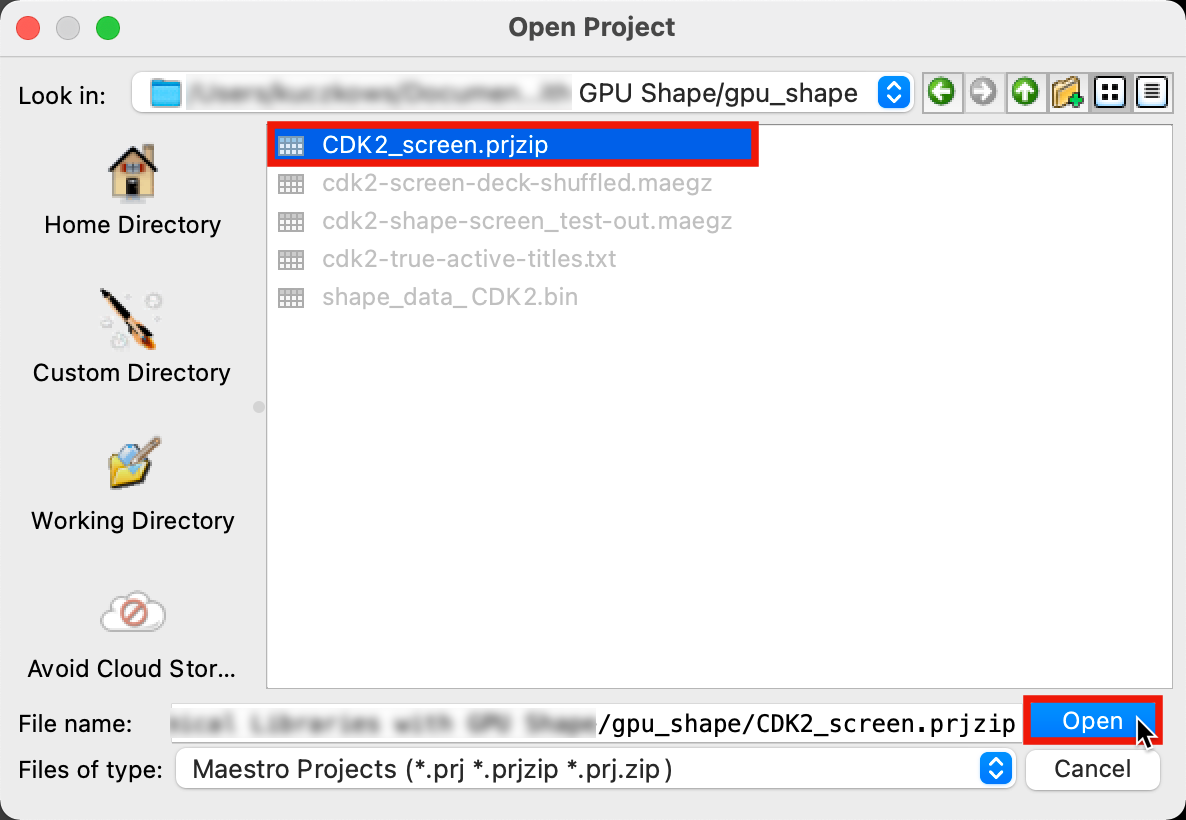
Figure 1-2. Save Project panel.
Go to File > Open Project
Select CDK2_screen.prjzip and click Open
In Save Scratch Project, click OK
Go to File > Save Project As
Change the File name to GPU-Shape, click Save
2 Selecting Template (Probe) Molecules for the Screen
The first step in executing a Shape screen of a chemical library is to construct a shape-based model of known small-molecule binders. Each molecule in the screening deck will be analyzed in the same way and compared with the profiles of each of the template or probe molecules. The ability of Shape to recover true actives is influenced by the diversity and number of probes. Increasing the number of diverse probes generally improves performance, and begins to saturate around 10 molecules. As we have 127 actives to choose from, we will start by selecting a diverse subset of these molecules using clustering tools available in Maestro.
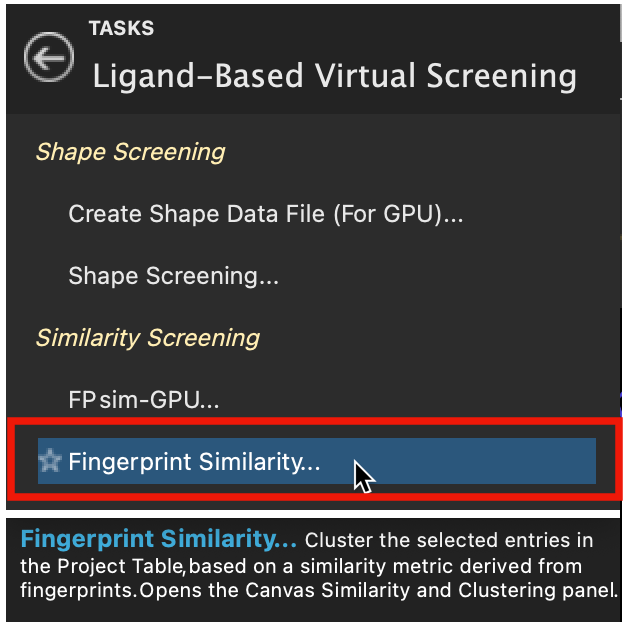
Figure 2-1. Fingerprint Similarity in Ligand-Based Virtual Screening.
- Select the CDK2-Actives group in the Entry List
- Go to Tasks > Browse > Ligand-Based Virtual Screening > Fingerprint Similarity
- The Canvas Similarity and Clustering panel opens
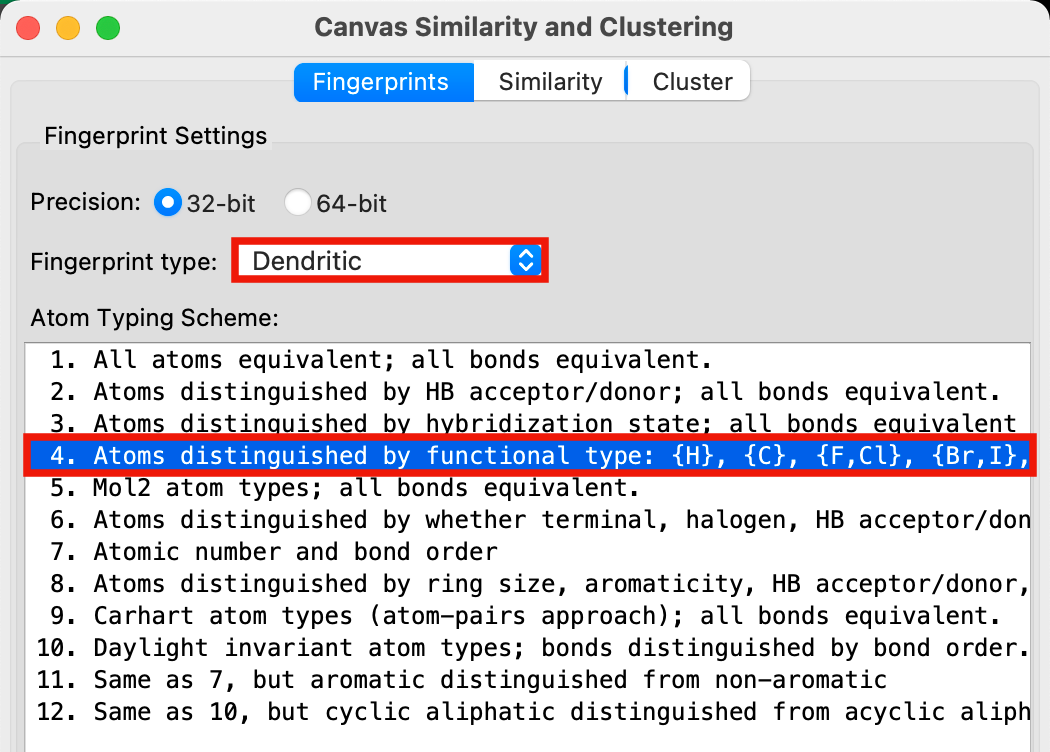
Figure 2-2. Fingerprints tab in Canvas Similarity and Clustering panel.
For Precision, select 32-bit
For Fingerprint type select Dendritic
For Atom Typing Scheme, choose
4. Atoms distinguished by functional type: {H}, {C}, {F,Cl}, {Br,I}, {N,O}, {S}, {other}; bonds by hybridization
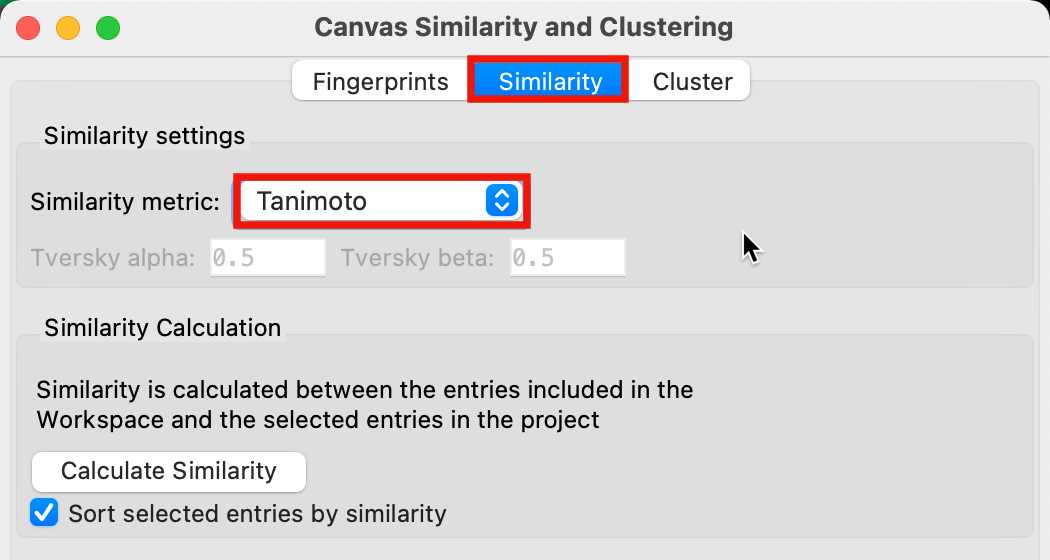
Figure 2-3. Similarity tab in the Canvas Similarity and Clustering panel.
Go to the Similarity tab
Set the Similarity metric to Tanimoto
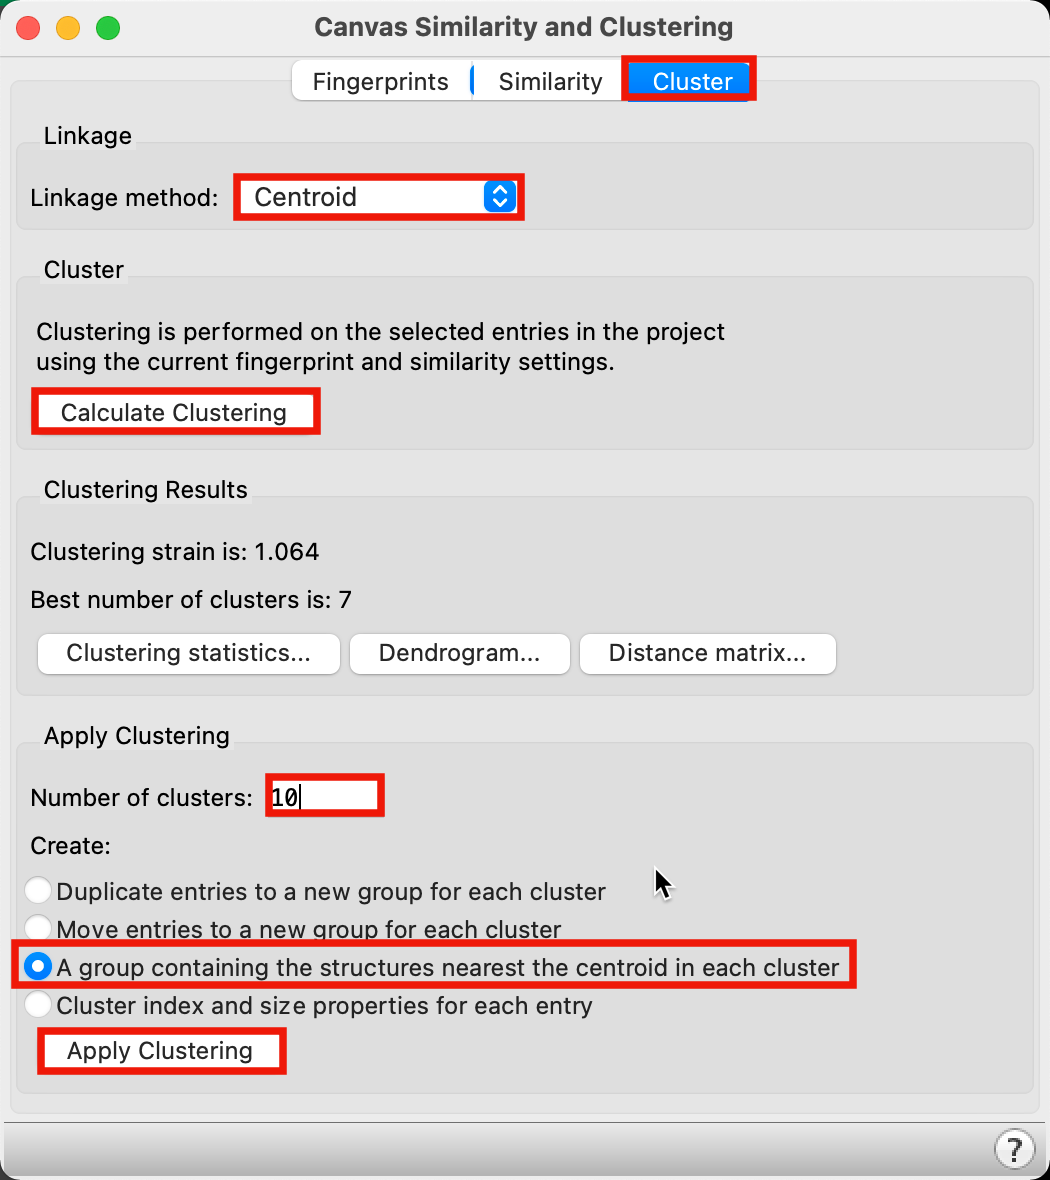
Figure 2-4. Apply Clustering.
Go to the Cluster tab
For Linkage method, choose Centroid
Click Calculate Clustering
Next to number of clusters, type 10
For Apply Clustering, choose A group containing the structures nearest the centroid in each cluster
Click Apply Clustering
A new group has been added to the Entry List
The representative molecules from this group will be the probe molecules for the Shape screen
3 Preparing a Screening Deck for Shape
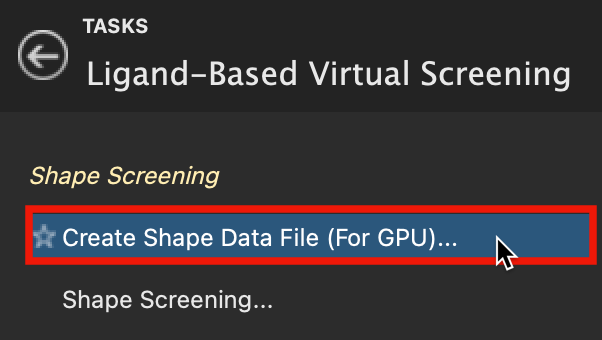
Figure 3-1. Create Shape Data File in Ligand-Based Virtual Screening.
- Go to Tasks > Browse > Ligand-Based Virtual Screening > Create Shape Data File (for GPU)
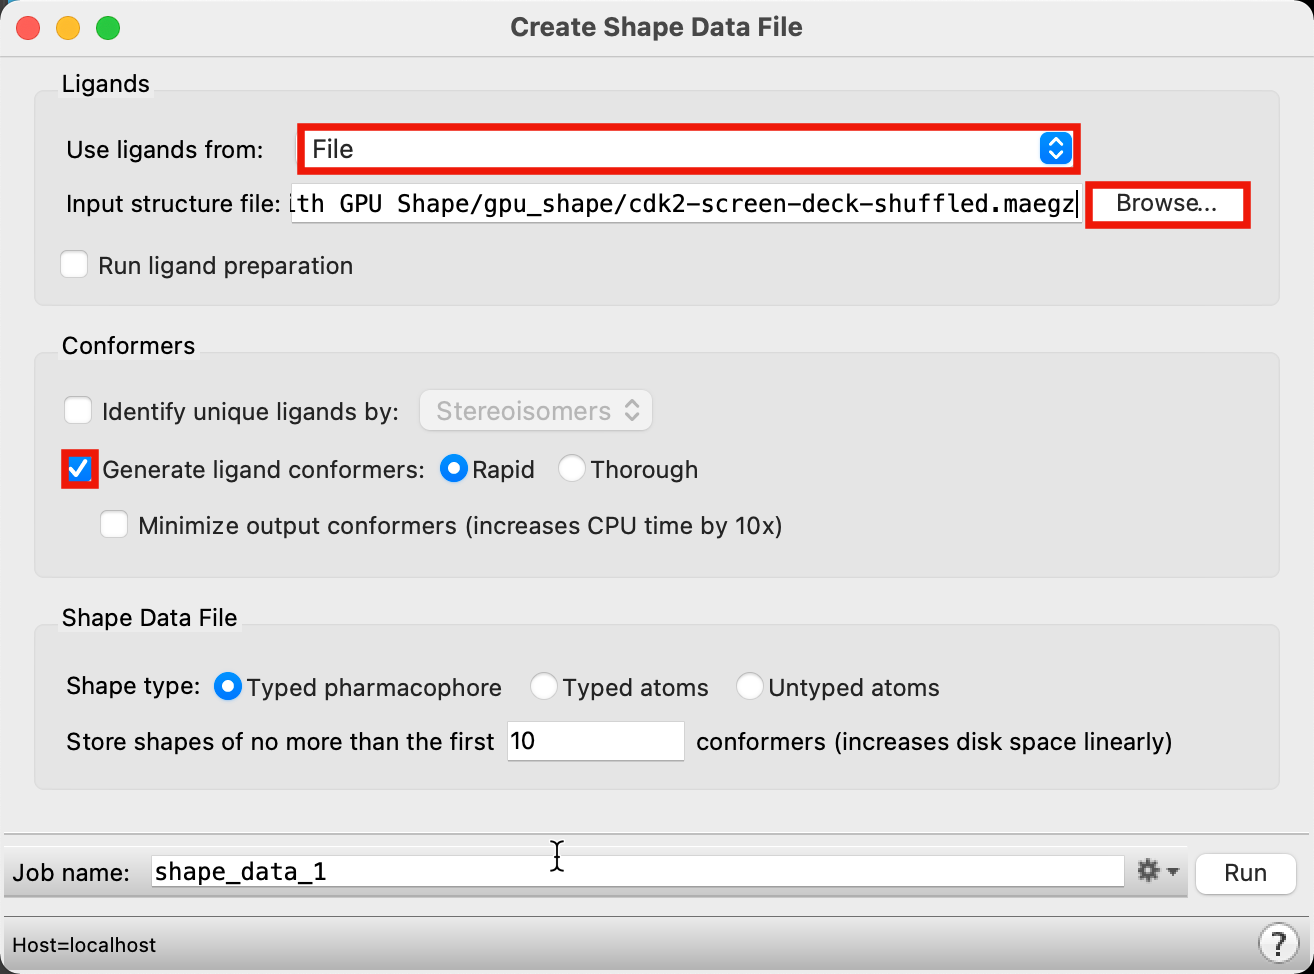
Figure 3-2. Create Shape Data File panel.
For Use ligands from, choose File
For Input structure file, click Browse and locate
cdk2-screen-deck-shuffled.maegz
Note: The input ligands have already been prepared with LigPrep
- For Conformers, select Generate ligand conformers and leave it set to Rapid
Both ligand preparation and conformer generation are unnecessary when using a Phase Database as the input. Typed pharmacophore is the recommended Shape type and requires that a shape from a probe molecule will only match a ligand from the screening deck when the two spheres have matching pharmacophore types
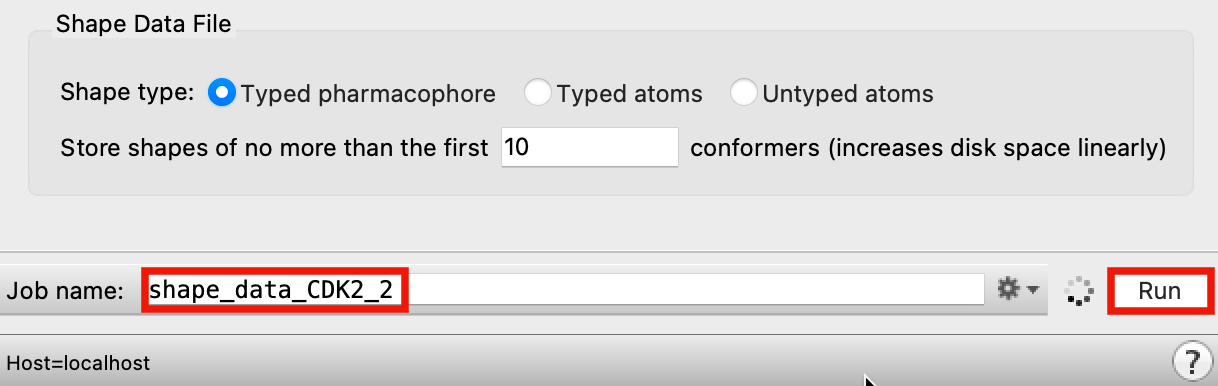
Figure 3-3. Run Create Shape Data File job.
Change Job name to shape_data_CDK2
Click Run
This job takes ~15 minutes
To save time, we will look at pregenerated results
4 Running GPU Shape Screen
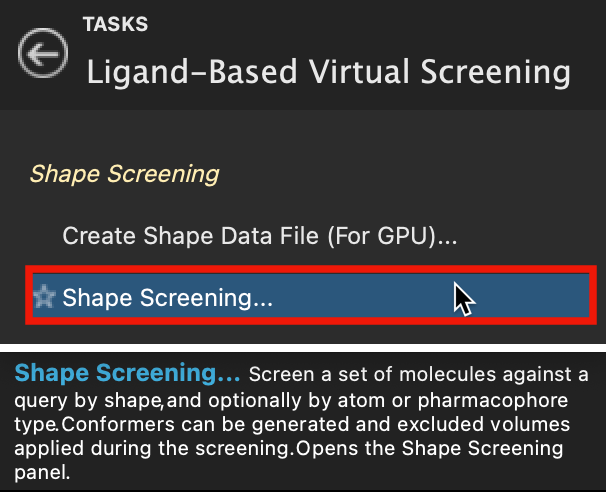
Figure 4-1. Shape Screening in Ligand-Based Virtual Screening.
Go to Tasks > Browse > Ligand-Based Virtual Screening > Shape Screening
Select the header of the Representative Entries group
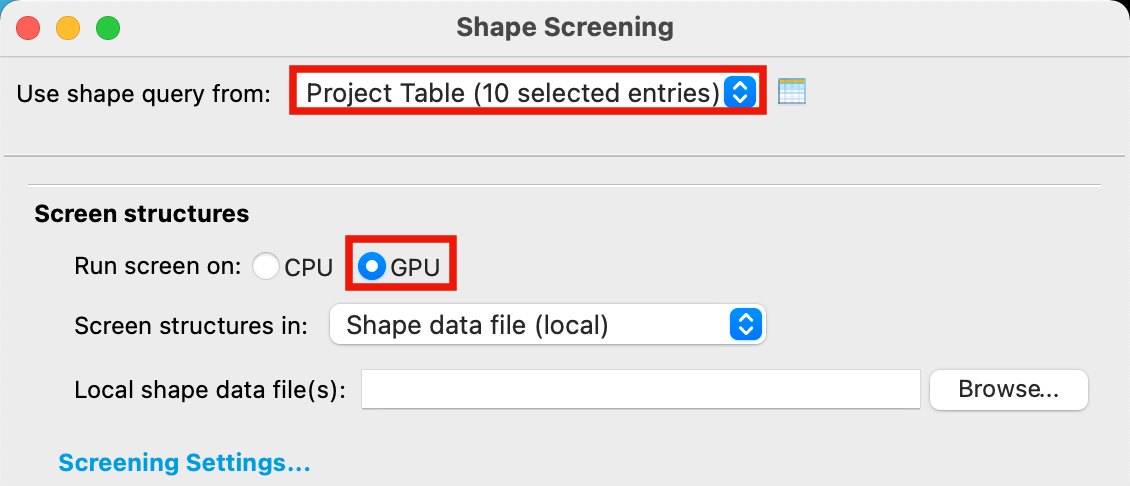
Figure 4-2. Load query file in Shape Screening panel.
For Use shape query from, choose Project Table
For Run screen on, choose GPU
Note: The GPU option for Run screen on is unavailable unless you have a machine with a GPU specified in your host file
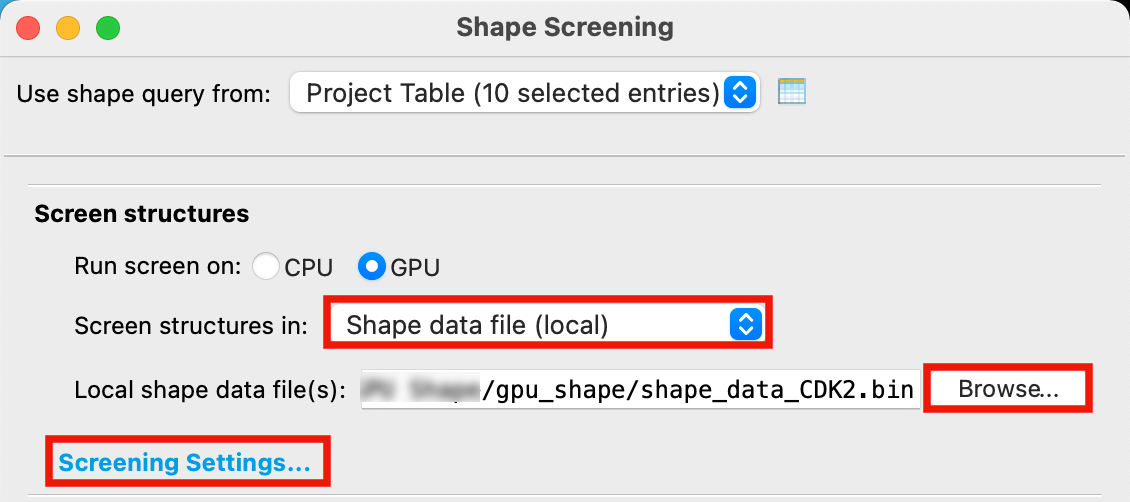
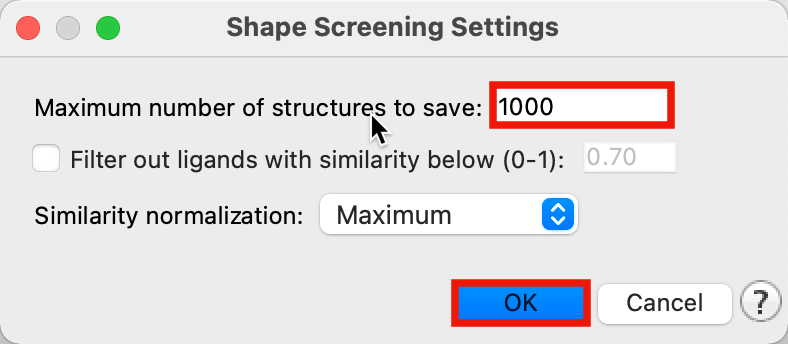
Figure 4-3. Set up Shape Screening job.
For Screen structures in, choose Shape data file (local)
Click Browse, locate
shape_data_cdk2.binand click OpenClick Screening Settings
For Maximum number of structures to save, type 1000
Click OK
Click the Job Settings (cog) button
- The Job Settings panel opens
If you check Include PDF report a PDF report of the top X matched ligands will be generated along with their alignment to a single probe (if you have selected multiple probes it will run just the first probe and show the results in the PDF)
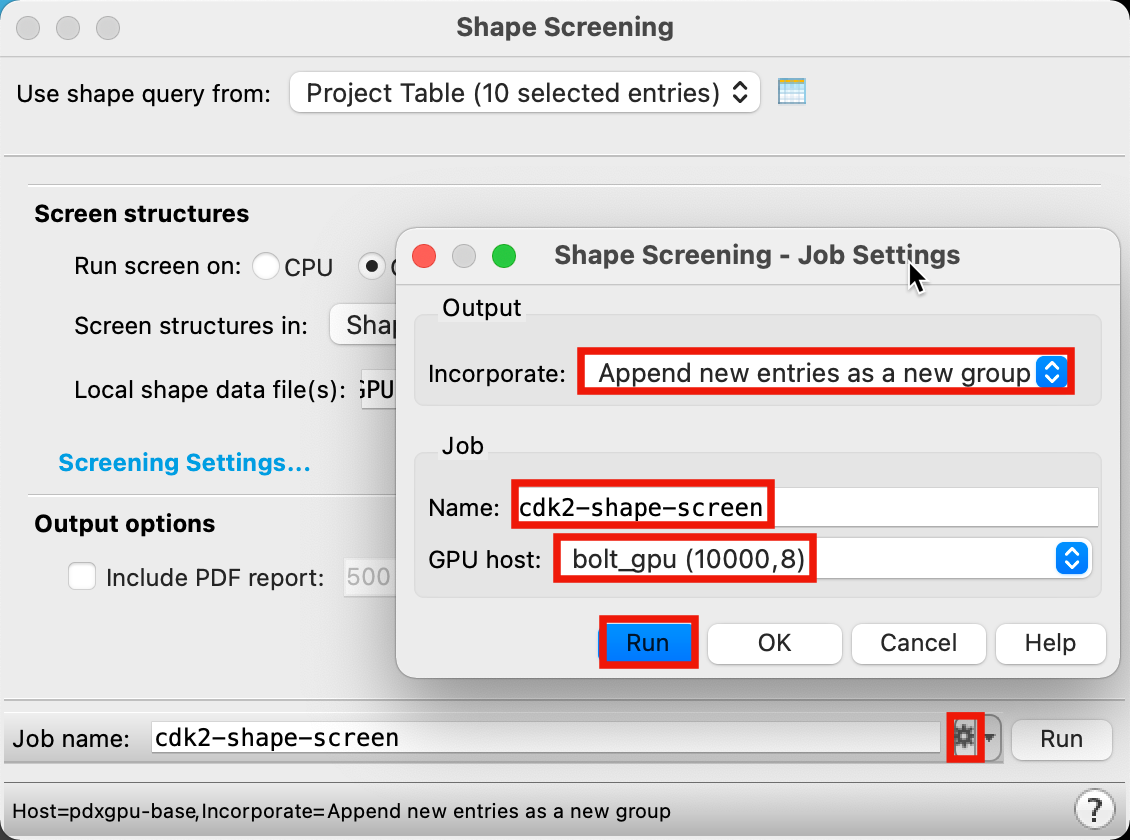
Figure 4-4. Run Shape Screening job.
For Incorporate, select Append new entries as a new group
Change Job name to cdk2-shape-screen
Select your desired GPU host
Click Run
The job will take a few minutes to complete
Results from the screen can also be found in
cdk2-shape-screen_test-out.maegz
1 GPU will be used by default. Jobs can be split across several GPUs from the command line. Job runtime varies depending on the graphics card used
5 Analyzing Shape Screening Results
In order to determine the impact of the Shape screen, we will look toward various enrichment metrics. These metrics help quantify a screening method’s effectiveness in differentiating true-actives from decoys.
5.1 Analyze enrichment for a single probe
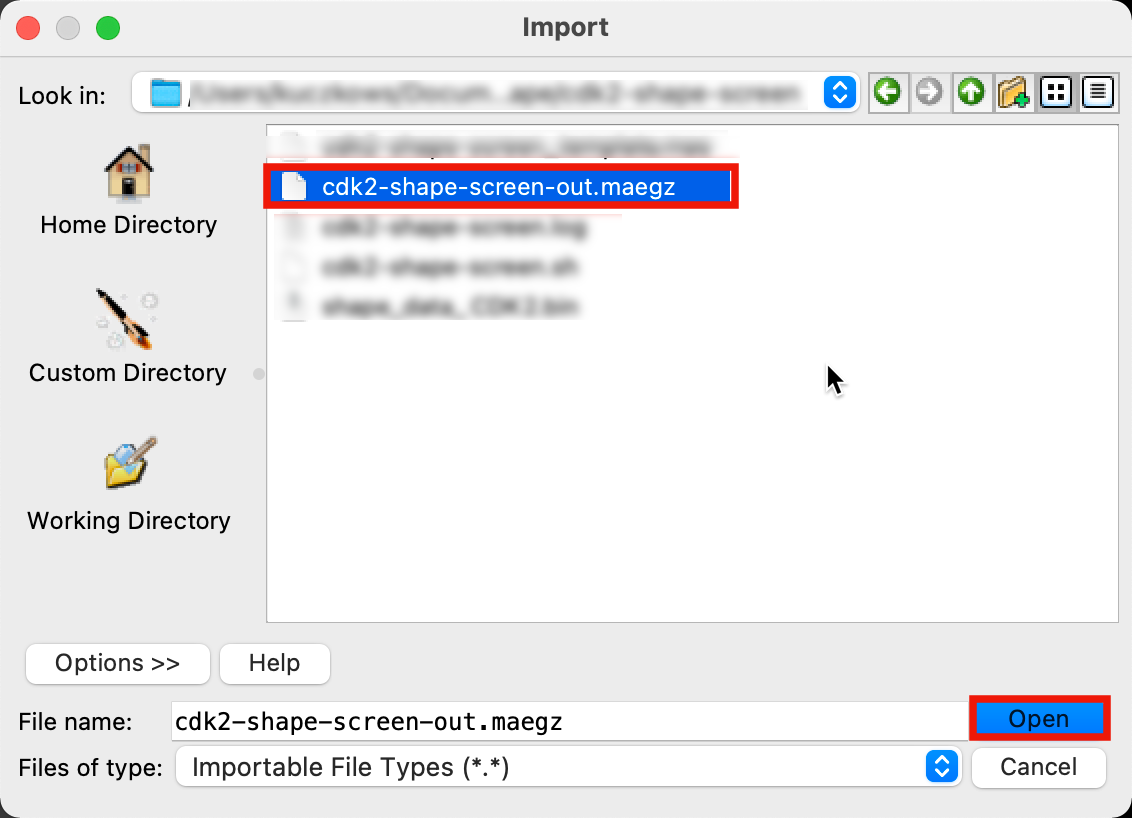
Figure 5-1. Import Shape Screening results.
Go to File > Import Structures
Select
cdk2-shape-screen-out.maegz(orcdk2-shape-screen_test-out.maegz)and click OpenIn the Entry List, select the top group labeled query 1
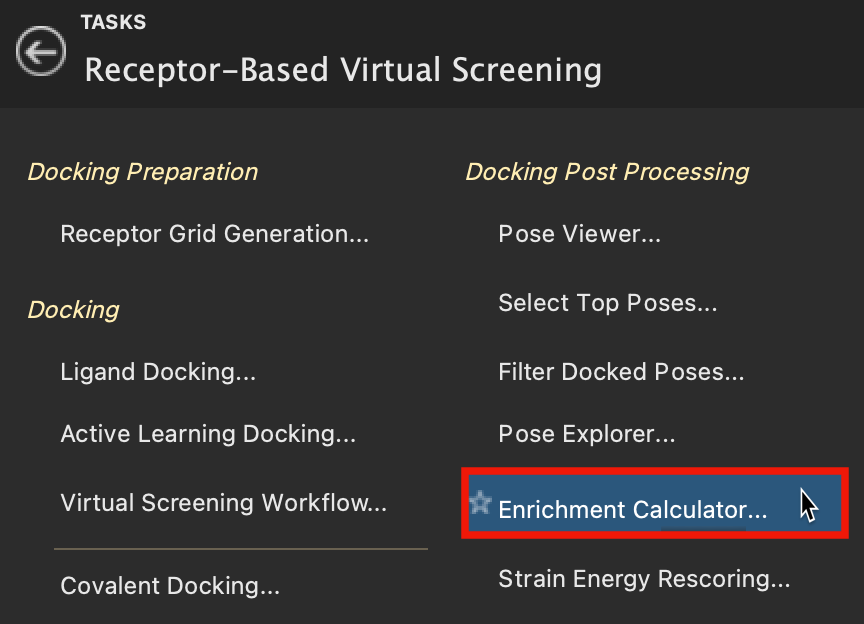
Figure 5-2. Enrichment Calculator in Receptor-Based Virtual Screening.
- Go to Tasks > Browse > Receptor-Based Virtual Screening > Enrichment Calculator
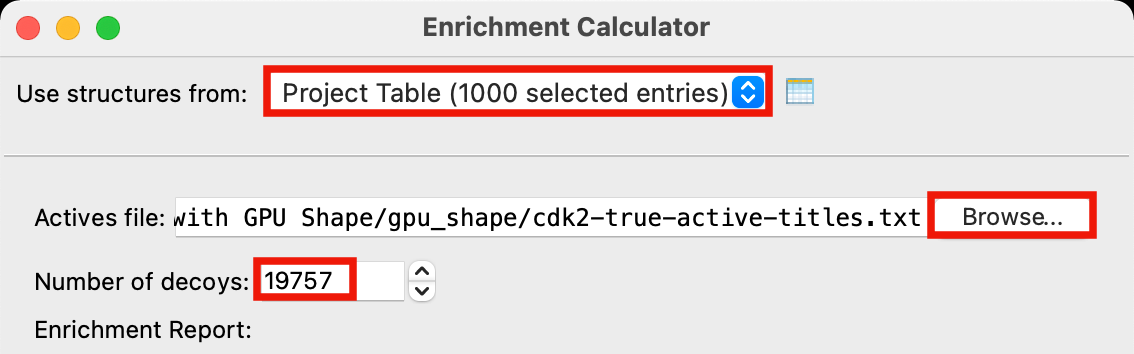
Figure 5-3. Set up Enrichment Calculator job.
For Use structures from, select Project Table (1000 selected entries)
For Actives file click Browse, locate
cdk2-true-active-titles.txtand click OpenFor Number of decoys, type 19757
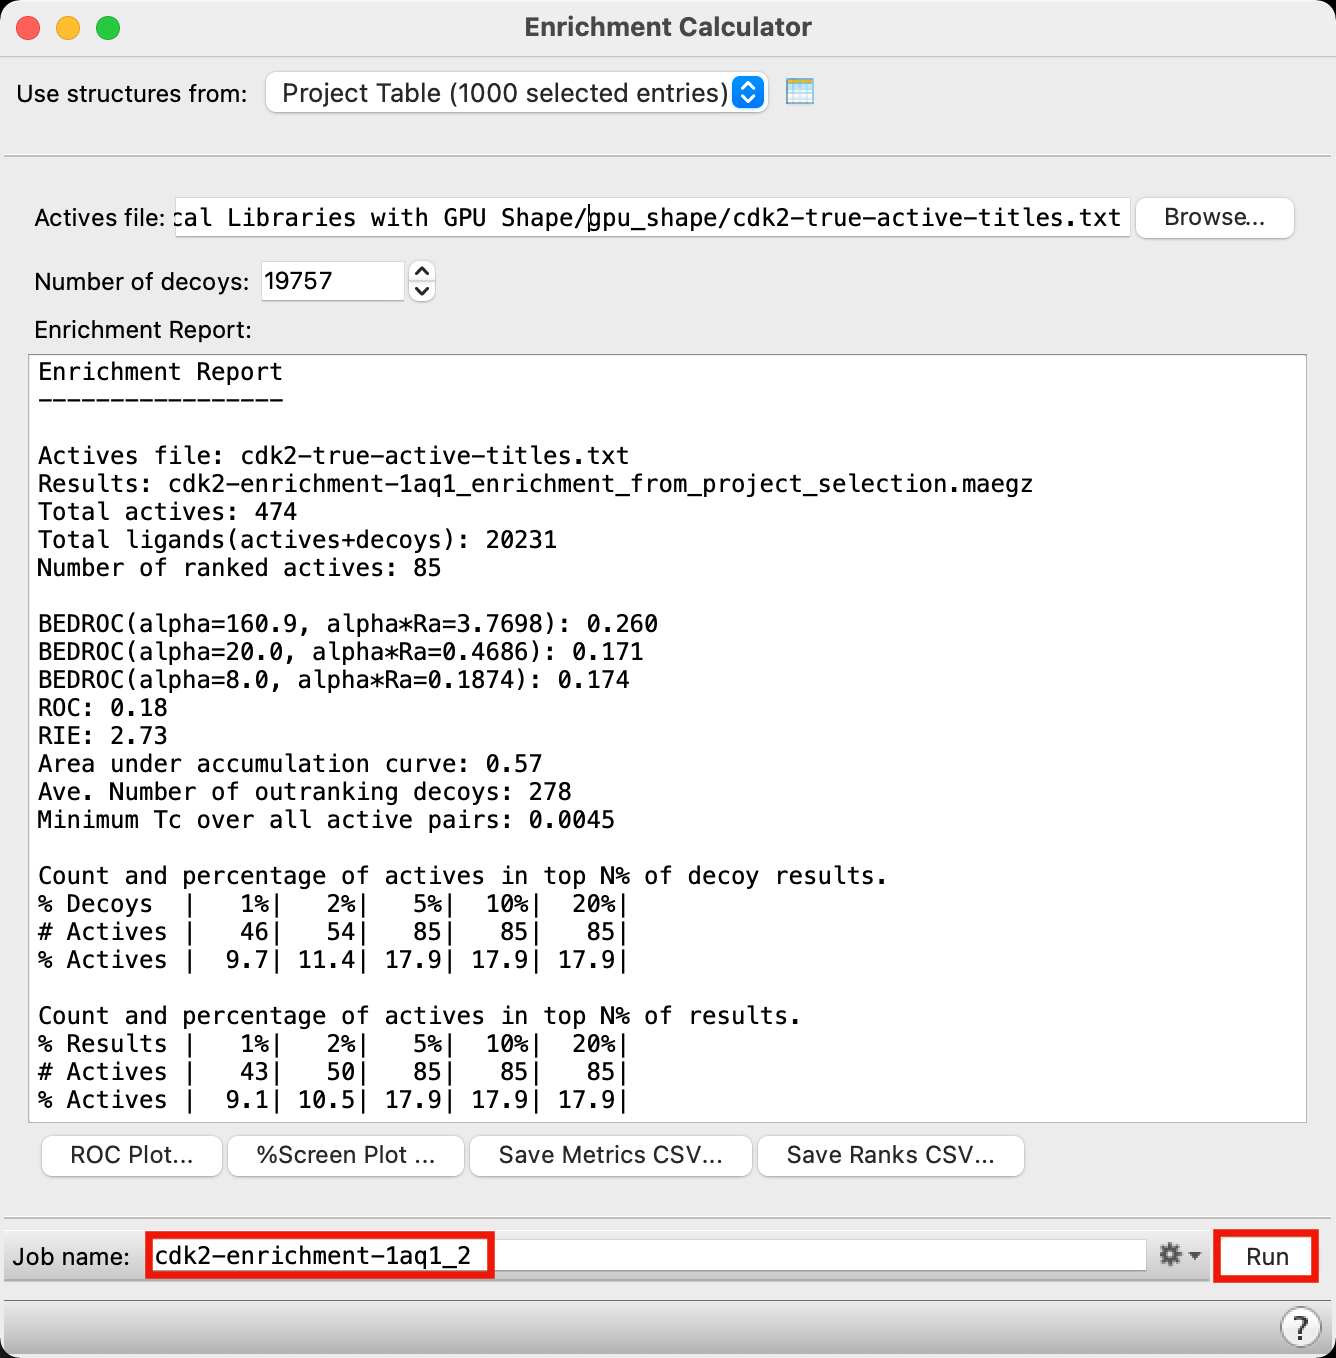
Figure 5-4. Run Enrichment Calculator job.
Change Job name to cdk2-enrichment-1aq1
Click Run
- The Enrichment Report populates with data within a few seconds
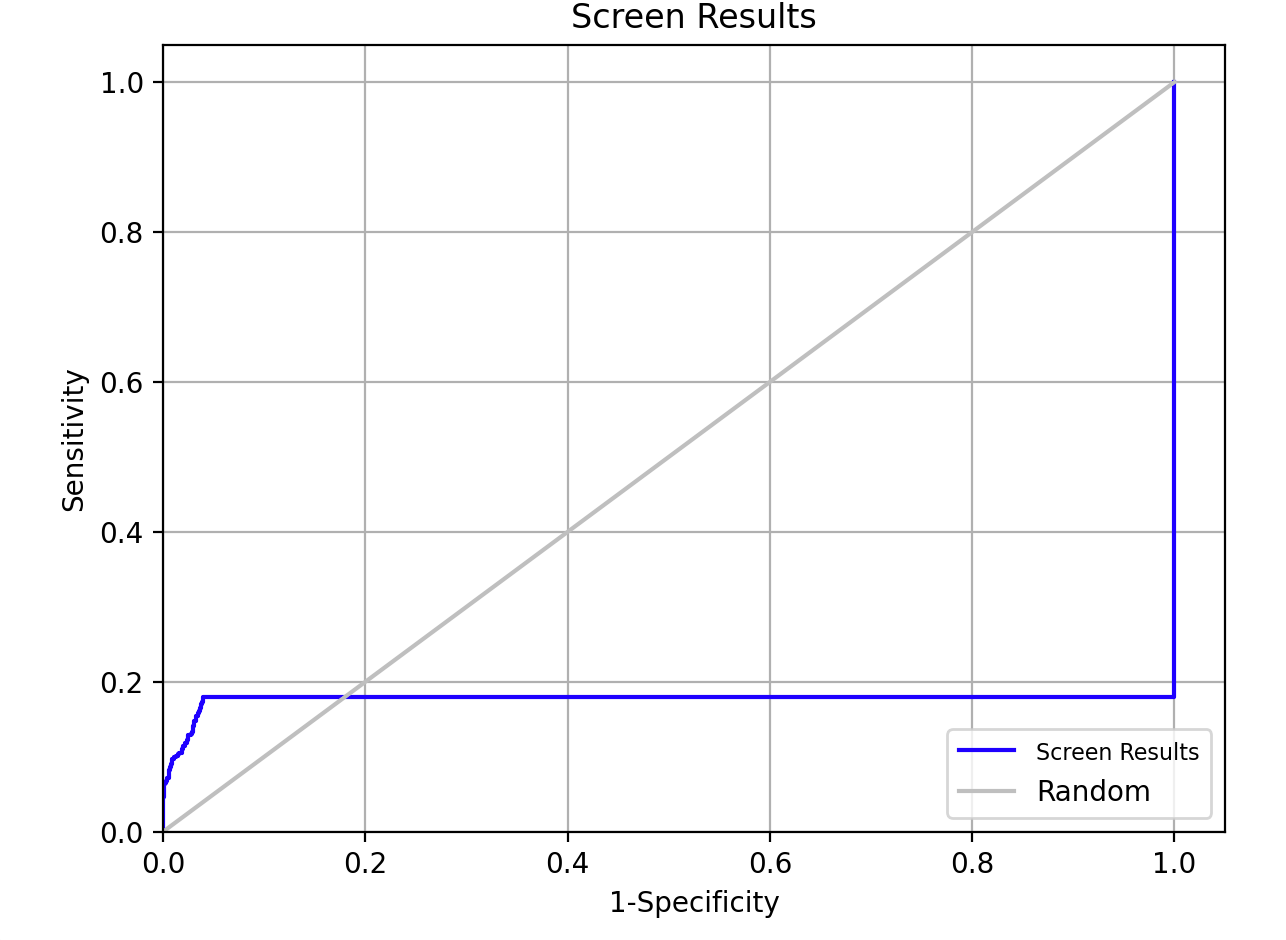
Figure 5-5. ROC Plot.
- Click ROC Plot
- The ROC Plot illustrates the performances of the screen in terms of active recovery compared with random
5.2 Analyze enrichment across all probes
To illustrate the impact of using additional probe molecules on the performance, we will merge the results across all of the probe molecules and repeat the enrichment calculation.
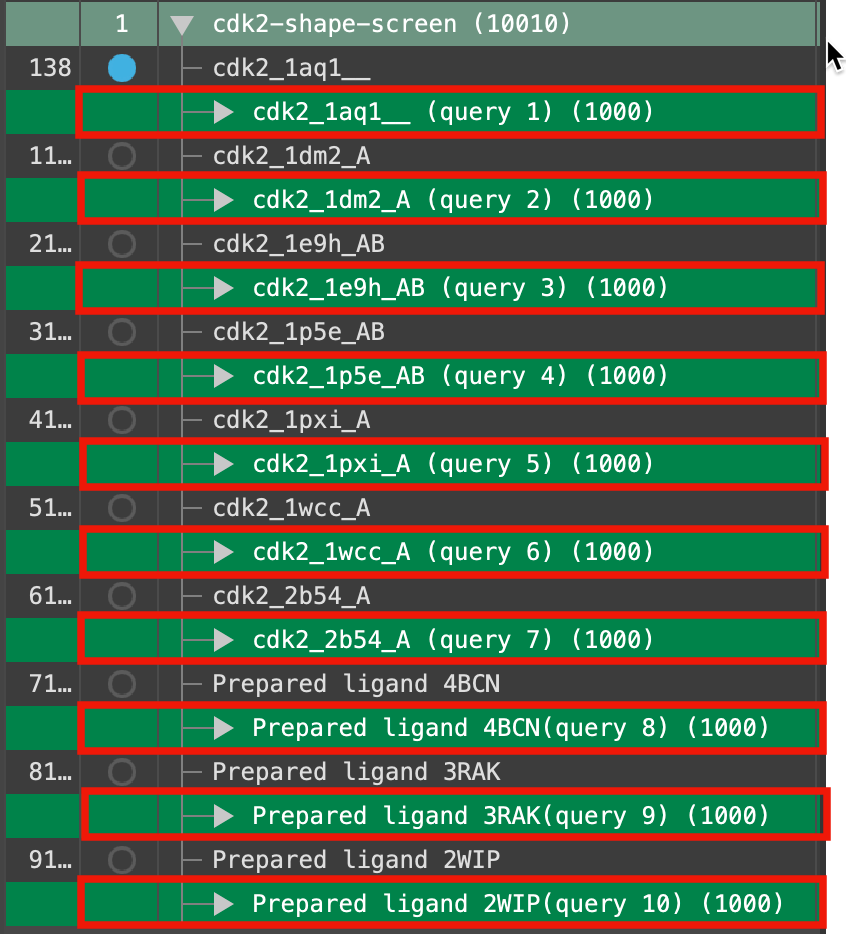
Figure 5-6. Query groups selected in the Entry List.
- In the Entry List, select each of the query groups
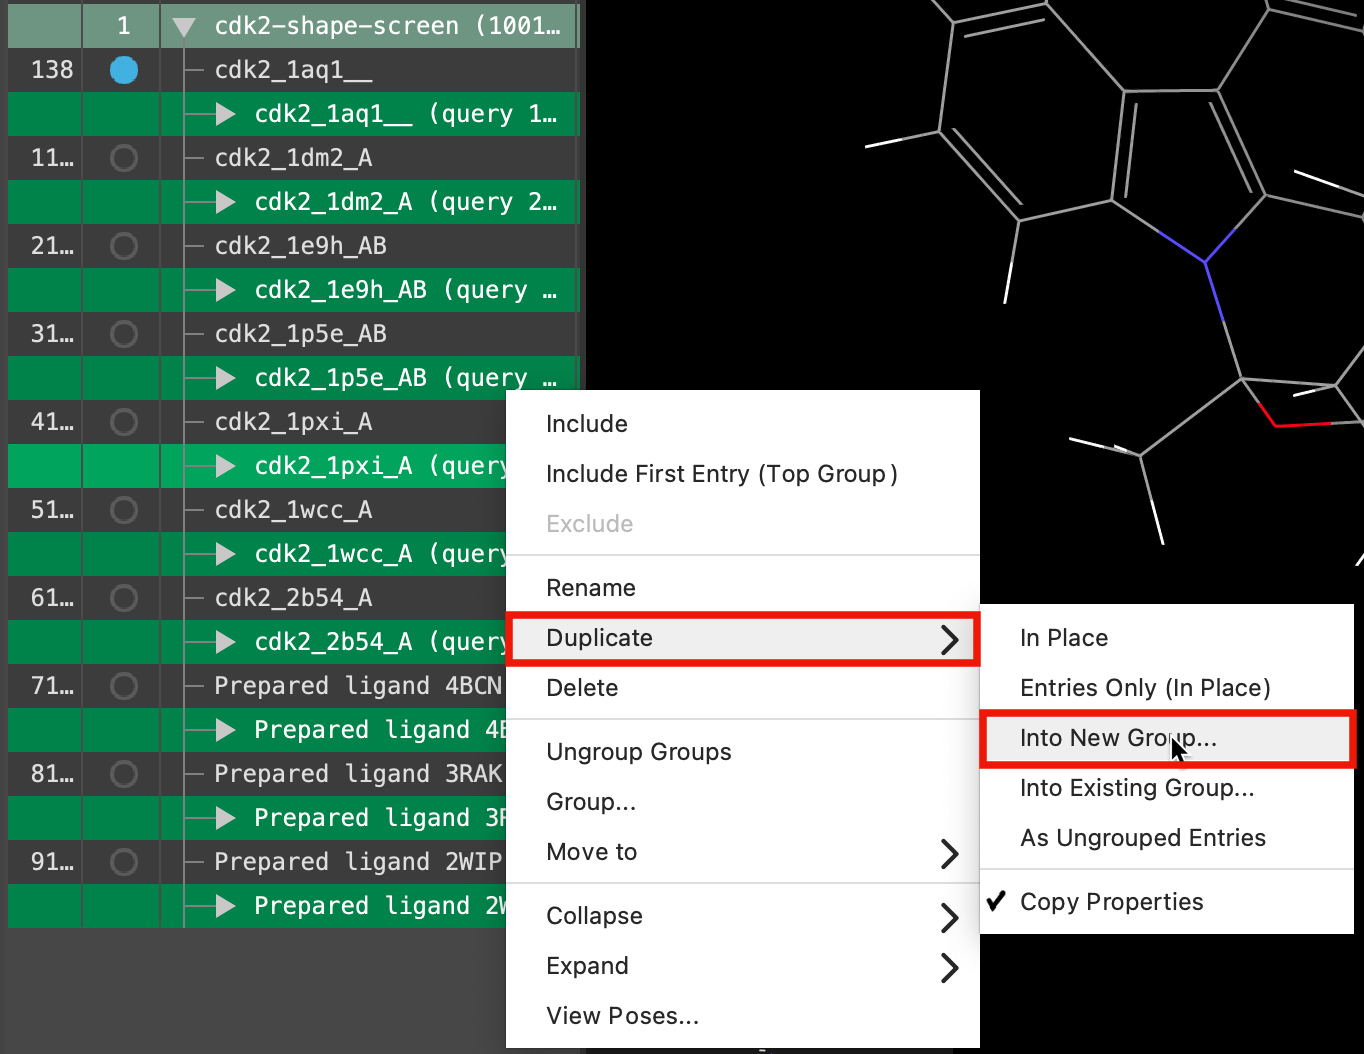
Figure 5-7. Duplicate selected structures.
- Right-click on the selected groups and select Duplicate > Into New Group
- The Duplicate into New Group panel opens
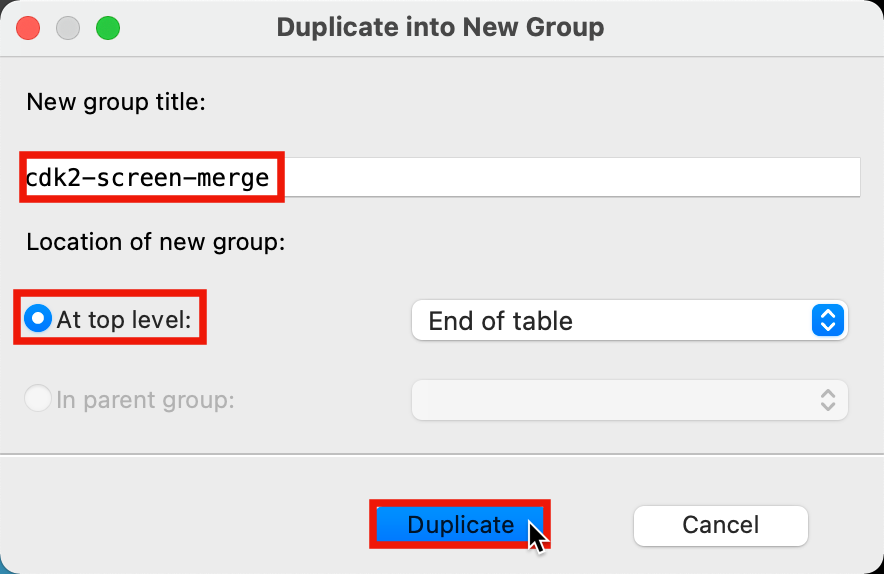
Figure 5-8. Duplicate into New Group panel.
For New group title, type cdk2-screen-merge
For Location of new group, choose At top level
Click Duplicate
- A new group has been added to the bottom of the Entry List
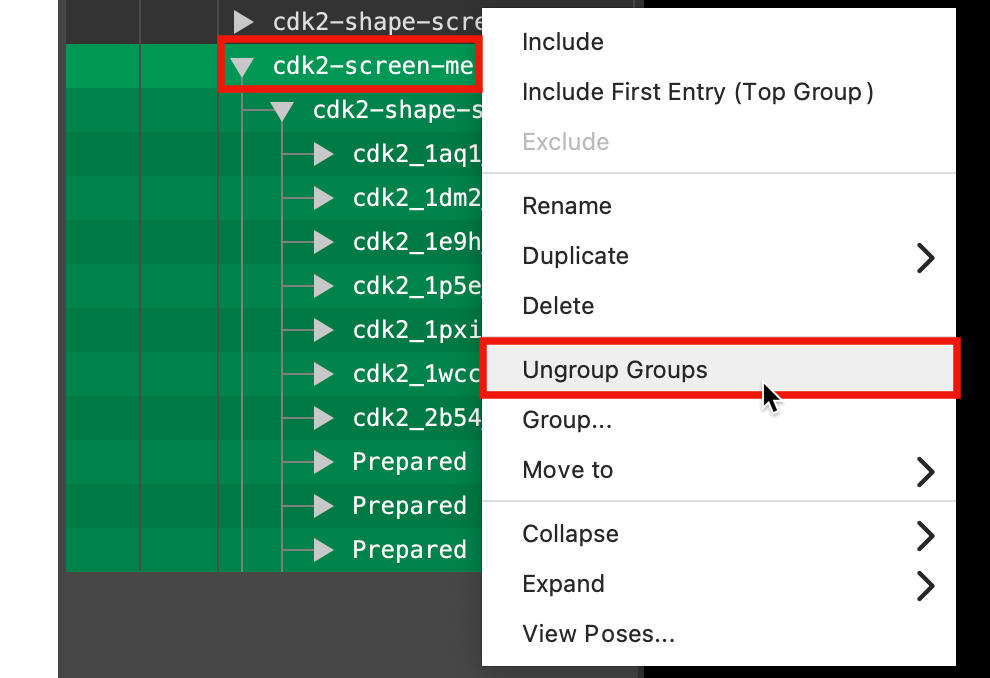
Figure 5-9. Ungroup the groups.
Select the cdk2_screen-merge group
Right-click on the selected groups and select Ungroup groups
Note: This is a shortcut to ungroup the groups for each of the the individual probes so we can group them all together in the same group (without any subgroups) in the next step
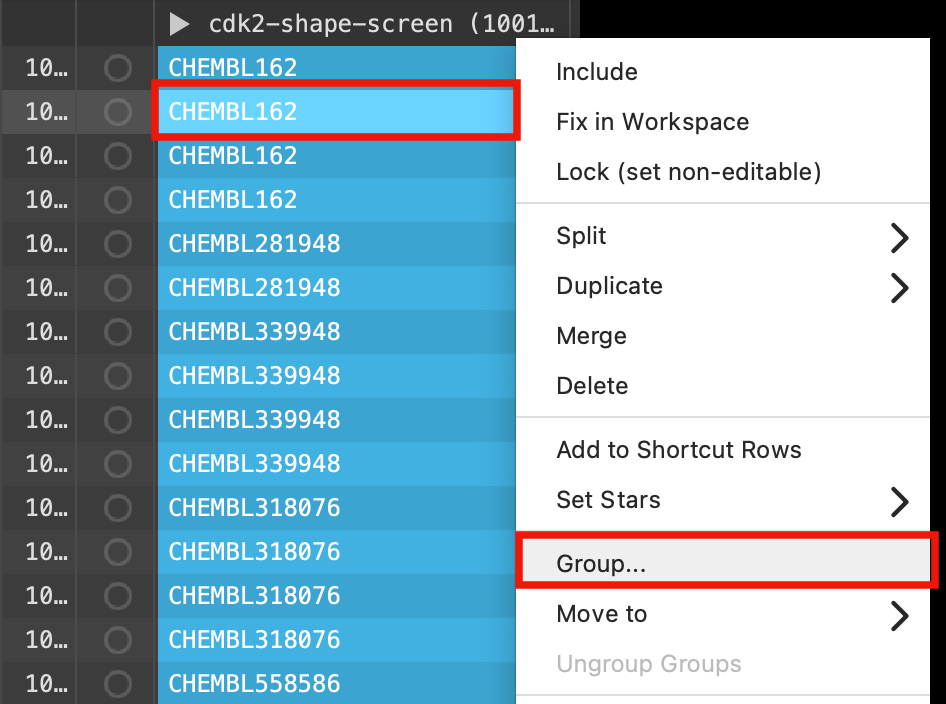
Figure 5-10. Re-group the outputs.
- Right-click one of the selected compounds and select Group
- The Group Selected Entries & Groups panel opens
For New group title type cdk2-screen-merge
For Location of new group, choose At top level and First select row
Click Create Group
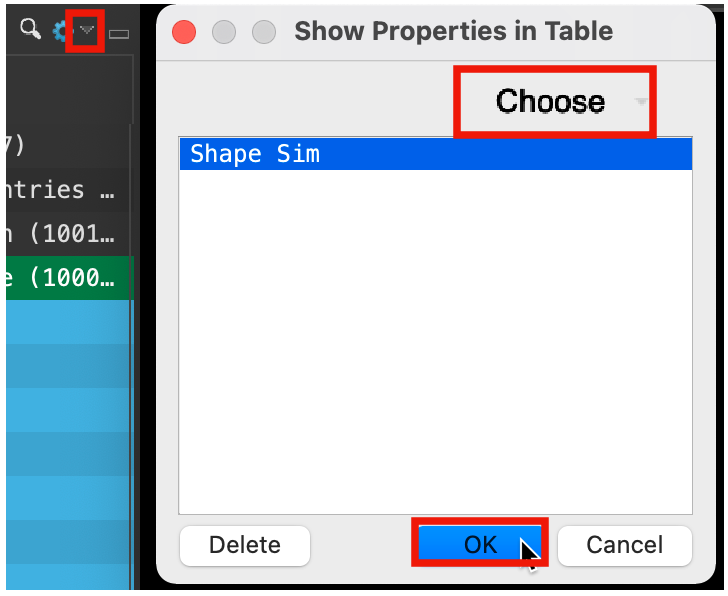
Figure 5-11. Add Shape Sim property.
At the top right corner of the Entry List, click the Settings button (cog)
Choose Show Property
Click Choose
Type Shape Sim
Choose Shape Sim
Click OK
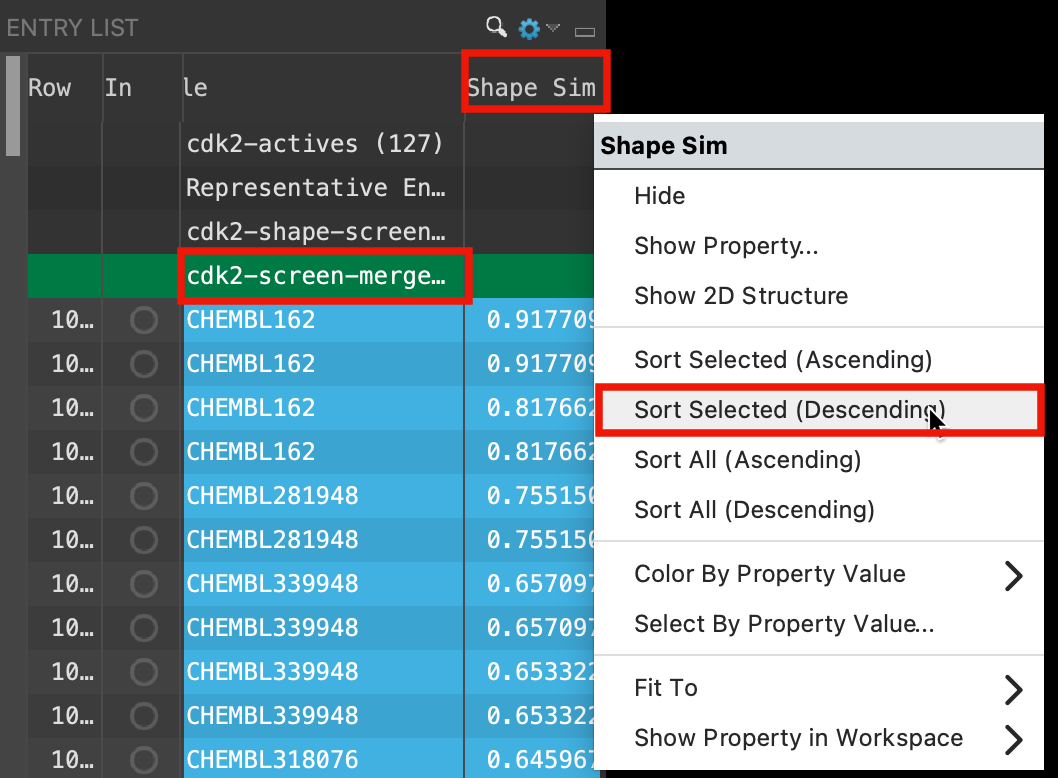
Figure 5-12. Sort structures by Shape Similarity Score.
Select the cdk2-screen-merge group in the Entry List
Right-click the Shape Sim column header
Select Sort Selected (Descending)
All of the grouping and ungrouping was necessary to get the output from all of the probes together in the same group so they could be sorted by Shape Sim
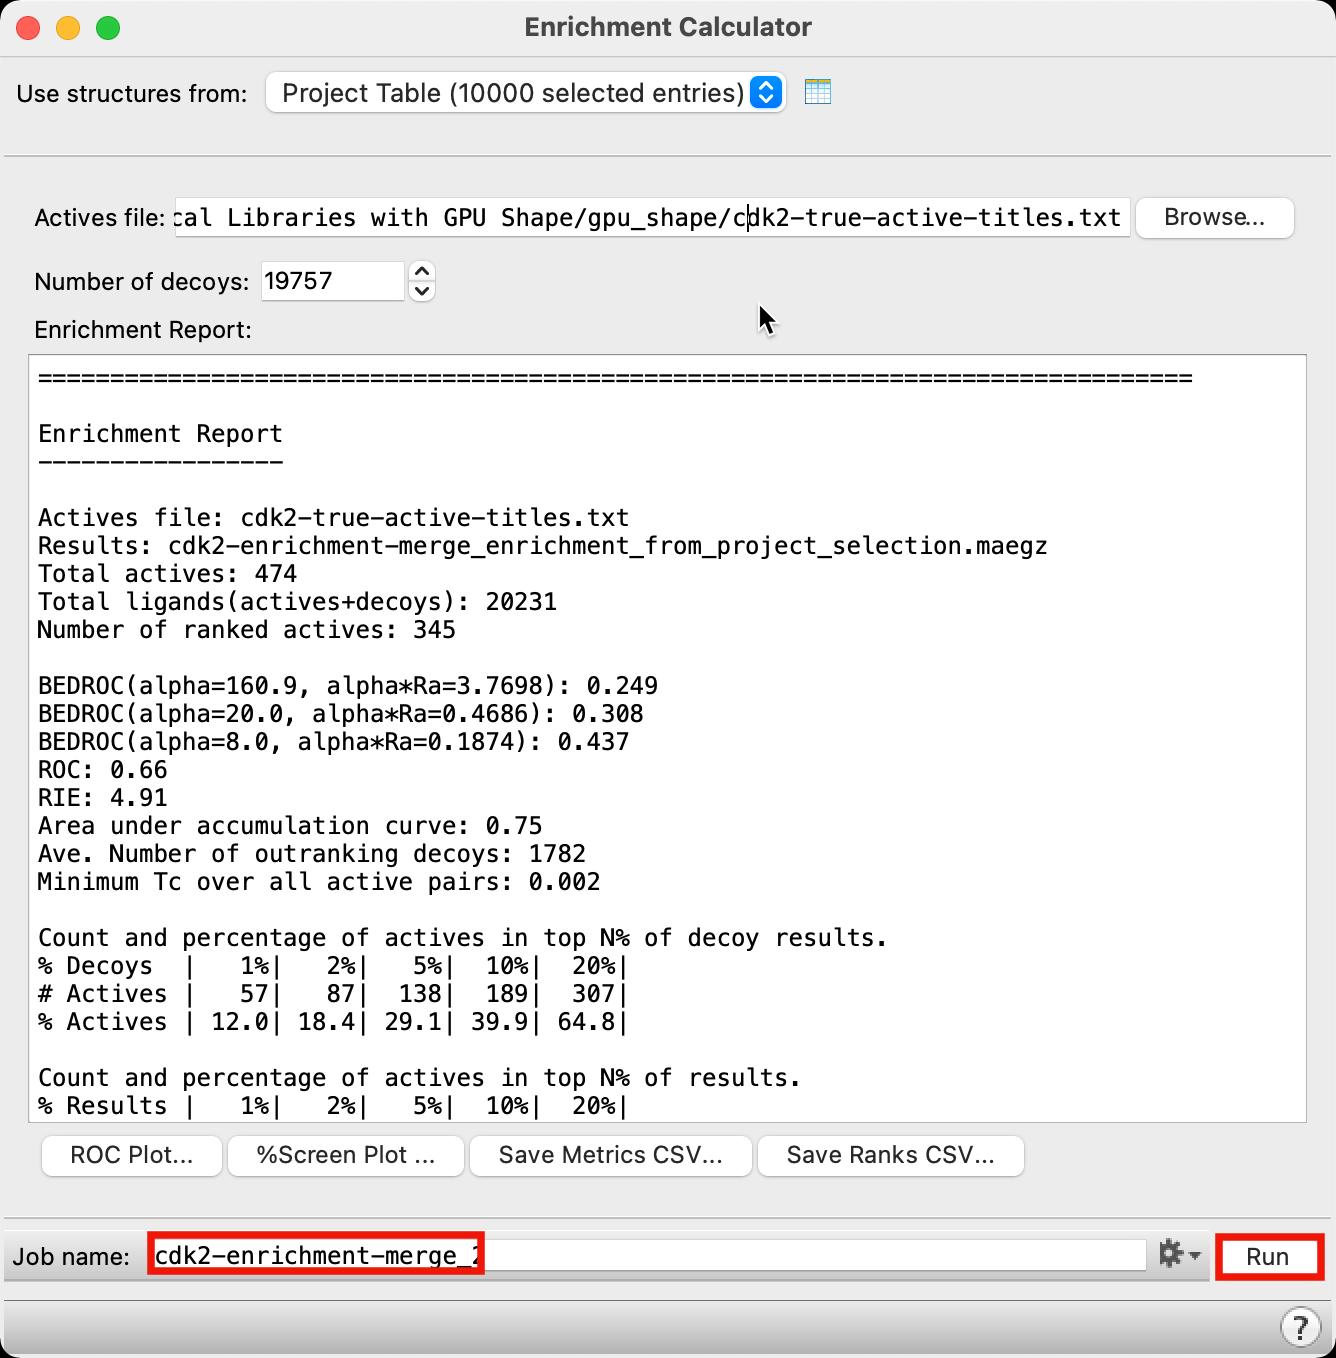
Figure 5-13. Run Enrichment Calculator job.
Open the Enrichment Calculator panel
Change Job name to cdk2-enrichment-merge
Click Run
- The Enrichment Report populates with data within a few seconds
Note: There is a clear improvement across all enrichment metrics compared to using a single probe alone
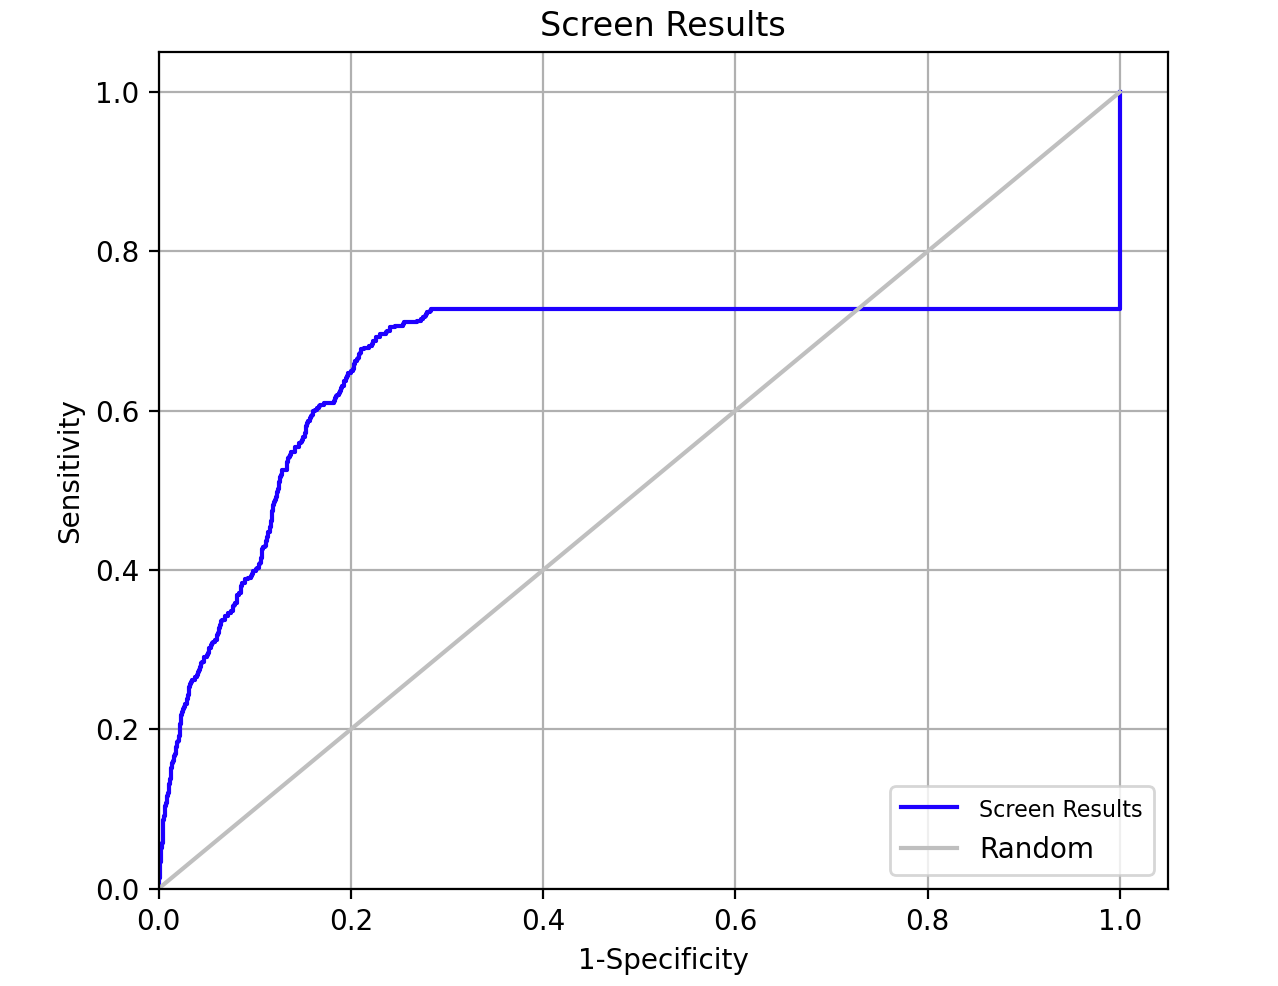
Figure 5-14. ROC Plot.
- Click ROC Plot
Note: The ROC Plot improves considerably with the addition of the remaining probes
6 Conclusion
In this tutorial, we screened over 20,000 compounds using GPU Shape. The diverse probe molecules were selected by clustering the known actives and retrieving representative structures. We then used those probes to screen our library of compounds and evaluate the enrichment with just one of the probes and then with all 10 probes.
References
[1] https://www.schrodinger.com/sites/default/files/s3/release/2023-4/Documentation/html/tutorials/gpu_shape/gpu_shape.htm