Schrödinger Notes—Ligand-based Pharmacophore Modeling
Declaration
This note is based on the article, “Ligand-Based Virtual Screening Using Phase”1, and created with the Schrödinger Software Release 2023-4.
This note contains only minimal annotations to the original text, along with corrections to formatting errors. It is intended for educational and communicative purposes only, and all rights remain with the original author.
Introduction
This tutorial demonstrates the creation of pharmacophore hypotheses from both congeneric and diverse ligands sets. You will learn how to create a pharmacophore hypothesis from a congeneric set of ligands with known experimental binding affinity. Additionally, you will learn how to create a Phase Database from a set of ligands, and use it to both prepare and filter a ligand library for future ligand screens or docking. Lastly, you will screen a Phase Database against a set of hypotheses, generate a pharmacophore hypothesis from a diverse ligand set, and visualize the binding modes.
1 Pharmacophore Modeling Prerequisites
Ligand files can be sourced from numerous places, such as vendors or databases, often in the form of 1D or 2D structures with unstandardized chemistry. LigPrep can convert ligand files to 3D structures, with the chemistry properly standardized and extrapolated, ready for use in virtual screening.
In this tutorial, the ligands have already been prepared in order to save time. Please see the Introduction to Structure Preparation and Visualization tutorial for instructions on using LigPrep.
2 Creating Projects and Importing Structures
At the start of the session, change the file path to your
chosen Working Directory in Maestro to make file navigation easier. Each
session in Maestro begins with a default Scratch Project, which is not
saved. A Maestro project stores all your data and has
a .prj extension. A project may contain numerous entries
corresponding to imported structures, as well as the output of
modeling-related tasks. Once a project is created, the project is
automatically saved each time a change is made.
Structures can be imported from the PDB directly, or from your Working Directory using File > Import Structures, and are automatically added to the Entry List and Project Table. The Entry List is located to the left of the Workspace. The Project Table can be accessed by Ctrl+T (Cmd+T) or Window > Project Table to see an expanded view of your project data.

- Double-click the Maestro icon
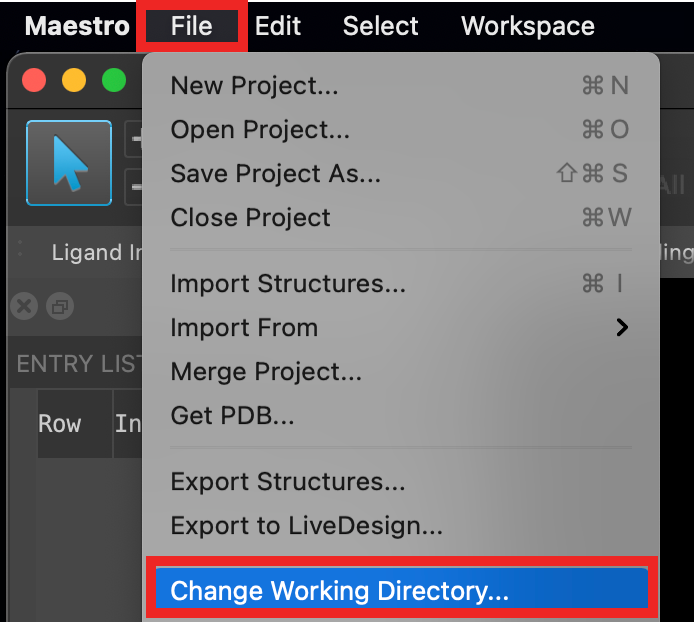
Figure 2-1. Change Working Directory option.
Go to File > Change Working Directory
Find your directory, and click Choose
Pre-generated input and results files are included for running jobs or examining output. Download the zip file here: https://www.schrodinger.com/sites/default/files/s3/release/current/Tutorials/zip/lbvs_phase_ligand.zip
After downloading the zip file, unzip the contents in your Working Directorythe location that files are saved for ease of access throughout the tutorial
Please note that calculations may have been run with an earlier version of the software and results may not exactly match with those you produce in this tutorial.
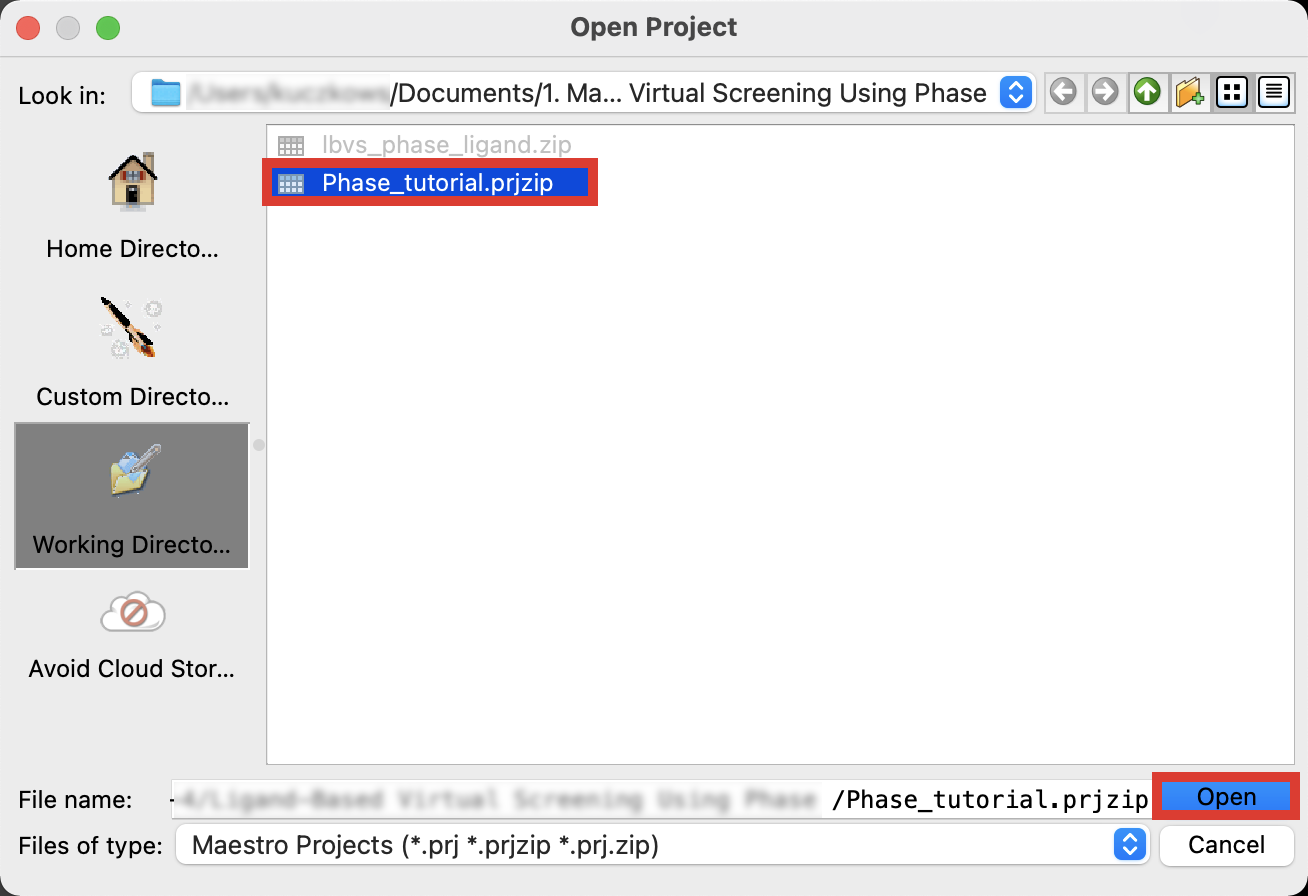
Figure 2-2. Save Project panel.
Go to File > Open Project >
Phase_tutorial.prjzip> OpenIn Save Scratch Project, click OK
Go to File > Save Project As
Change the File name to Phase_ligand_tutorial
Click Save
3 Developing Hypotheses from a Congeneric Ligand Series
In this section, we will generate a pharmacophore hypothesis from a congeneric (a series of ligands that are structurally related, such as sharing a common core) series of ligands with experimental binding affinities.
3.1 Creating hypotheses
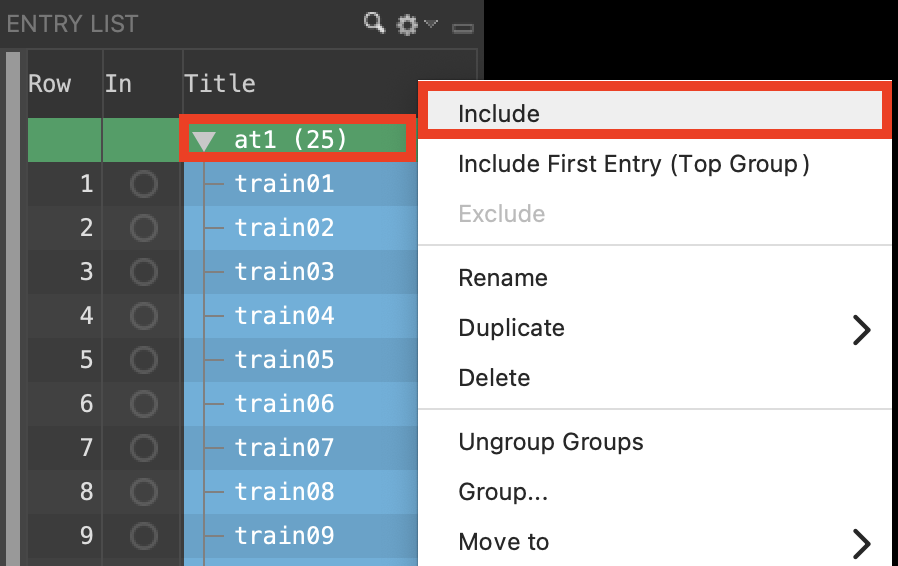
Figure 3-1. Include at1 entries.
Select and expand the group at1
Right-click at1 and choose Include
In the Warning panel, click Continue
Ligands are displayed in the Workspace
Ligands are not aligned
Ligand Alignment is very important for the generation of pharmacophores from a ligand series. While Phase can (and will as a default) automatically find the best alignment and common features, it is at times beneficial to manually pre-align your ligands using the Flexible Ligand Alignment tool before importing the ligands into Phase. That can be useful when trying to align to a known bioactive conformation.
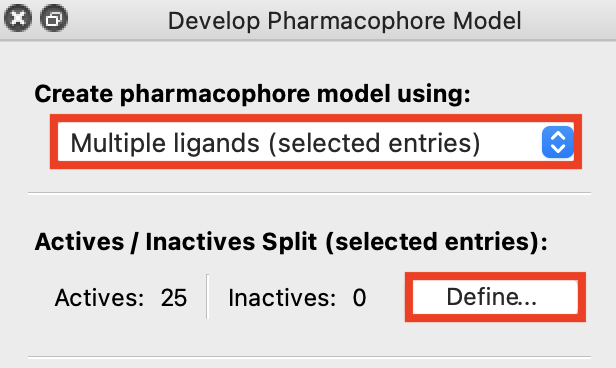
Figure 3-2. Defining actives and inactives for multiple ligands (selected entries).
Go to Tasks > Browse > Ligand-Based Virtual Screening > Develop Pharmacophore Hypotheses
Under Create pharmacophore model using, choose Multiple ligands (selected entries)
For Actives/Inactives Split (selected entries), click Define
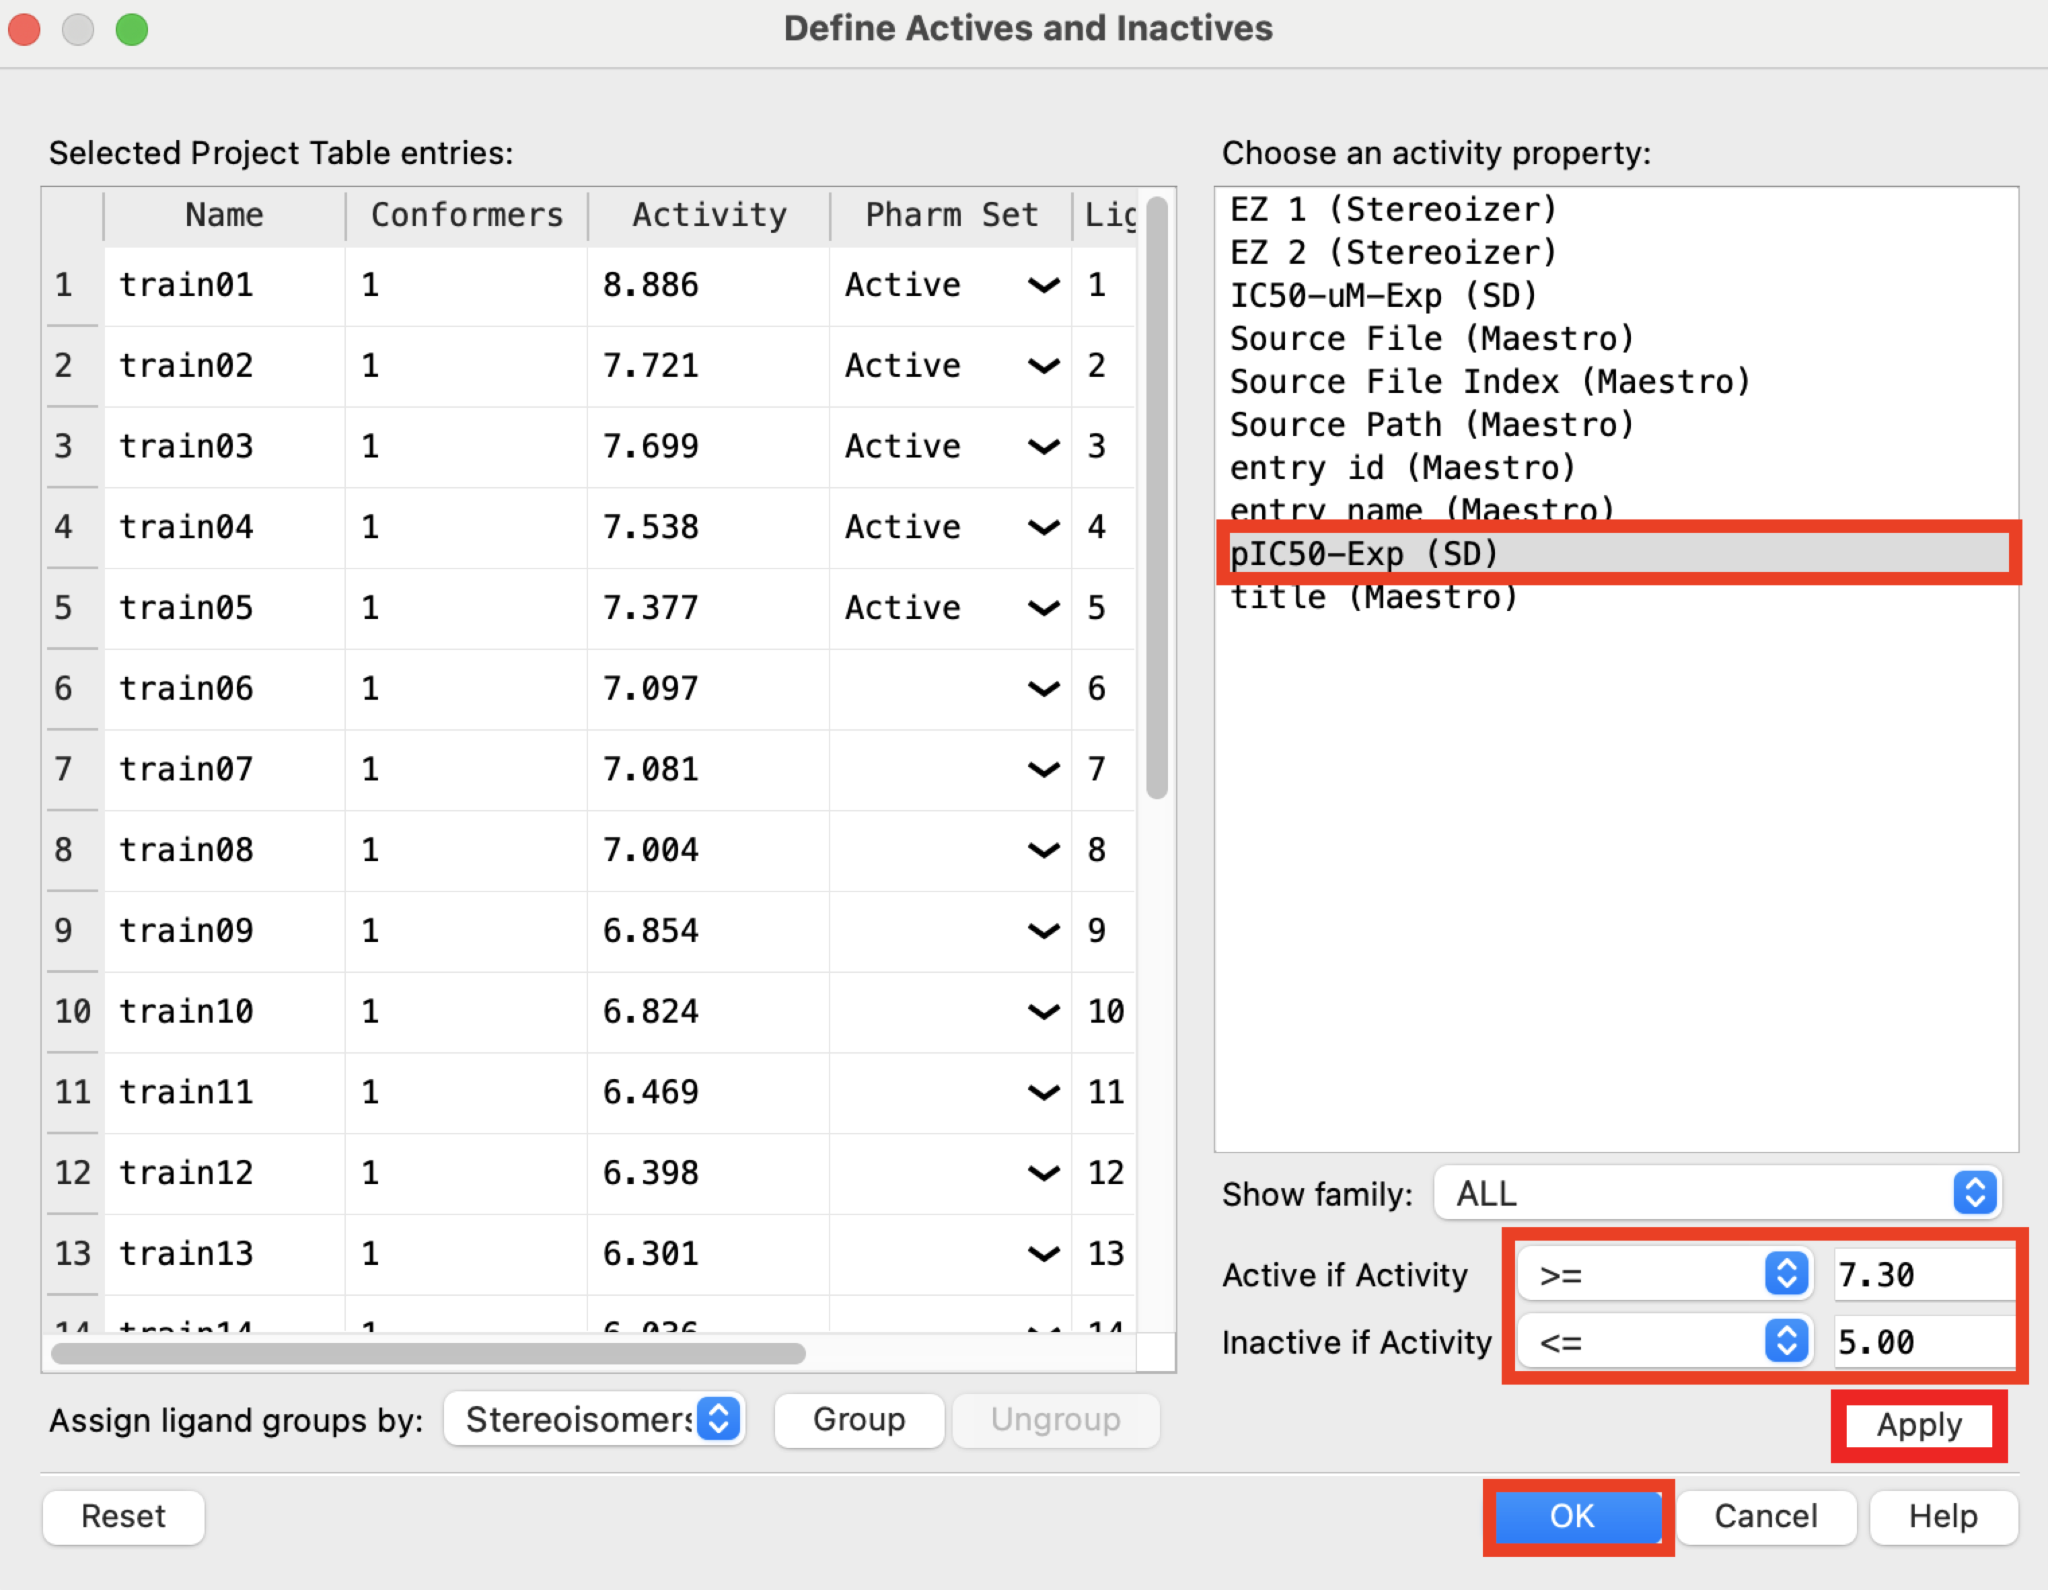
Figure 3-3. Define Actives and Inactives panel.
- For Available properties, choose pIC50-Exp
Note: This property contains experimental binding affinities converted to a free energy scale by pIC50 = -log(IC50). IC50 ≤ 50 nM affinity corresponds to pIC50 ≥ 7.3. The threshold for recognizing an inactive will be 10 µM or pIC50 ≤ 5.0.
Set Active if activity is to >= 7.30
Set Inactive if activity is to <= 5.00
Click Apply and OK
You can also specify ligands that must match a hypothesis for the hypothesis to be returned by checking the Required Match column for the desired ligand
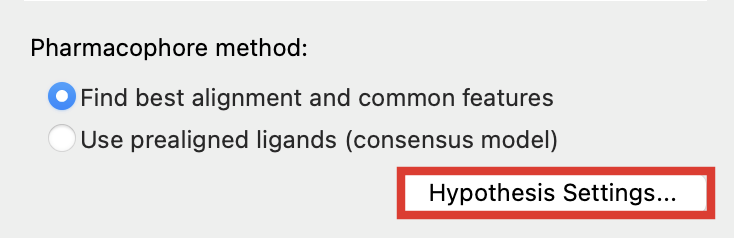
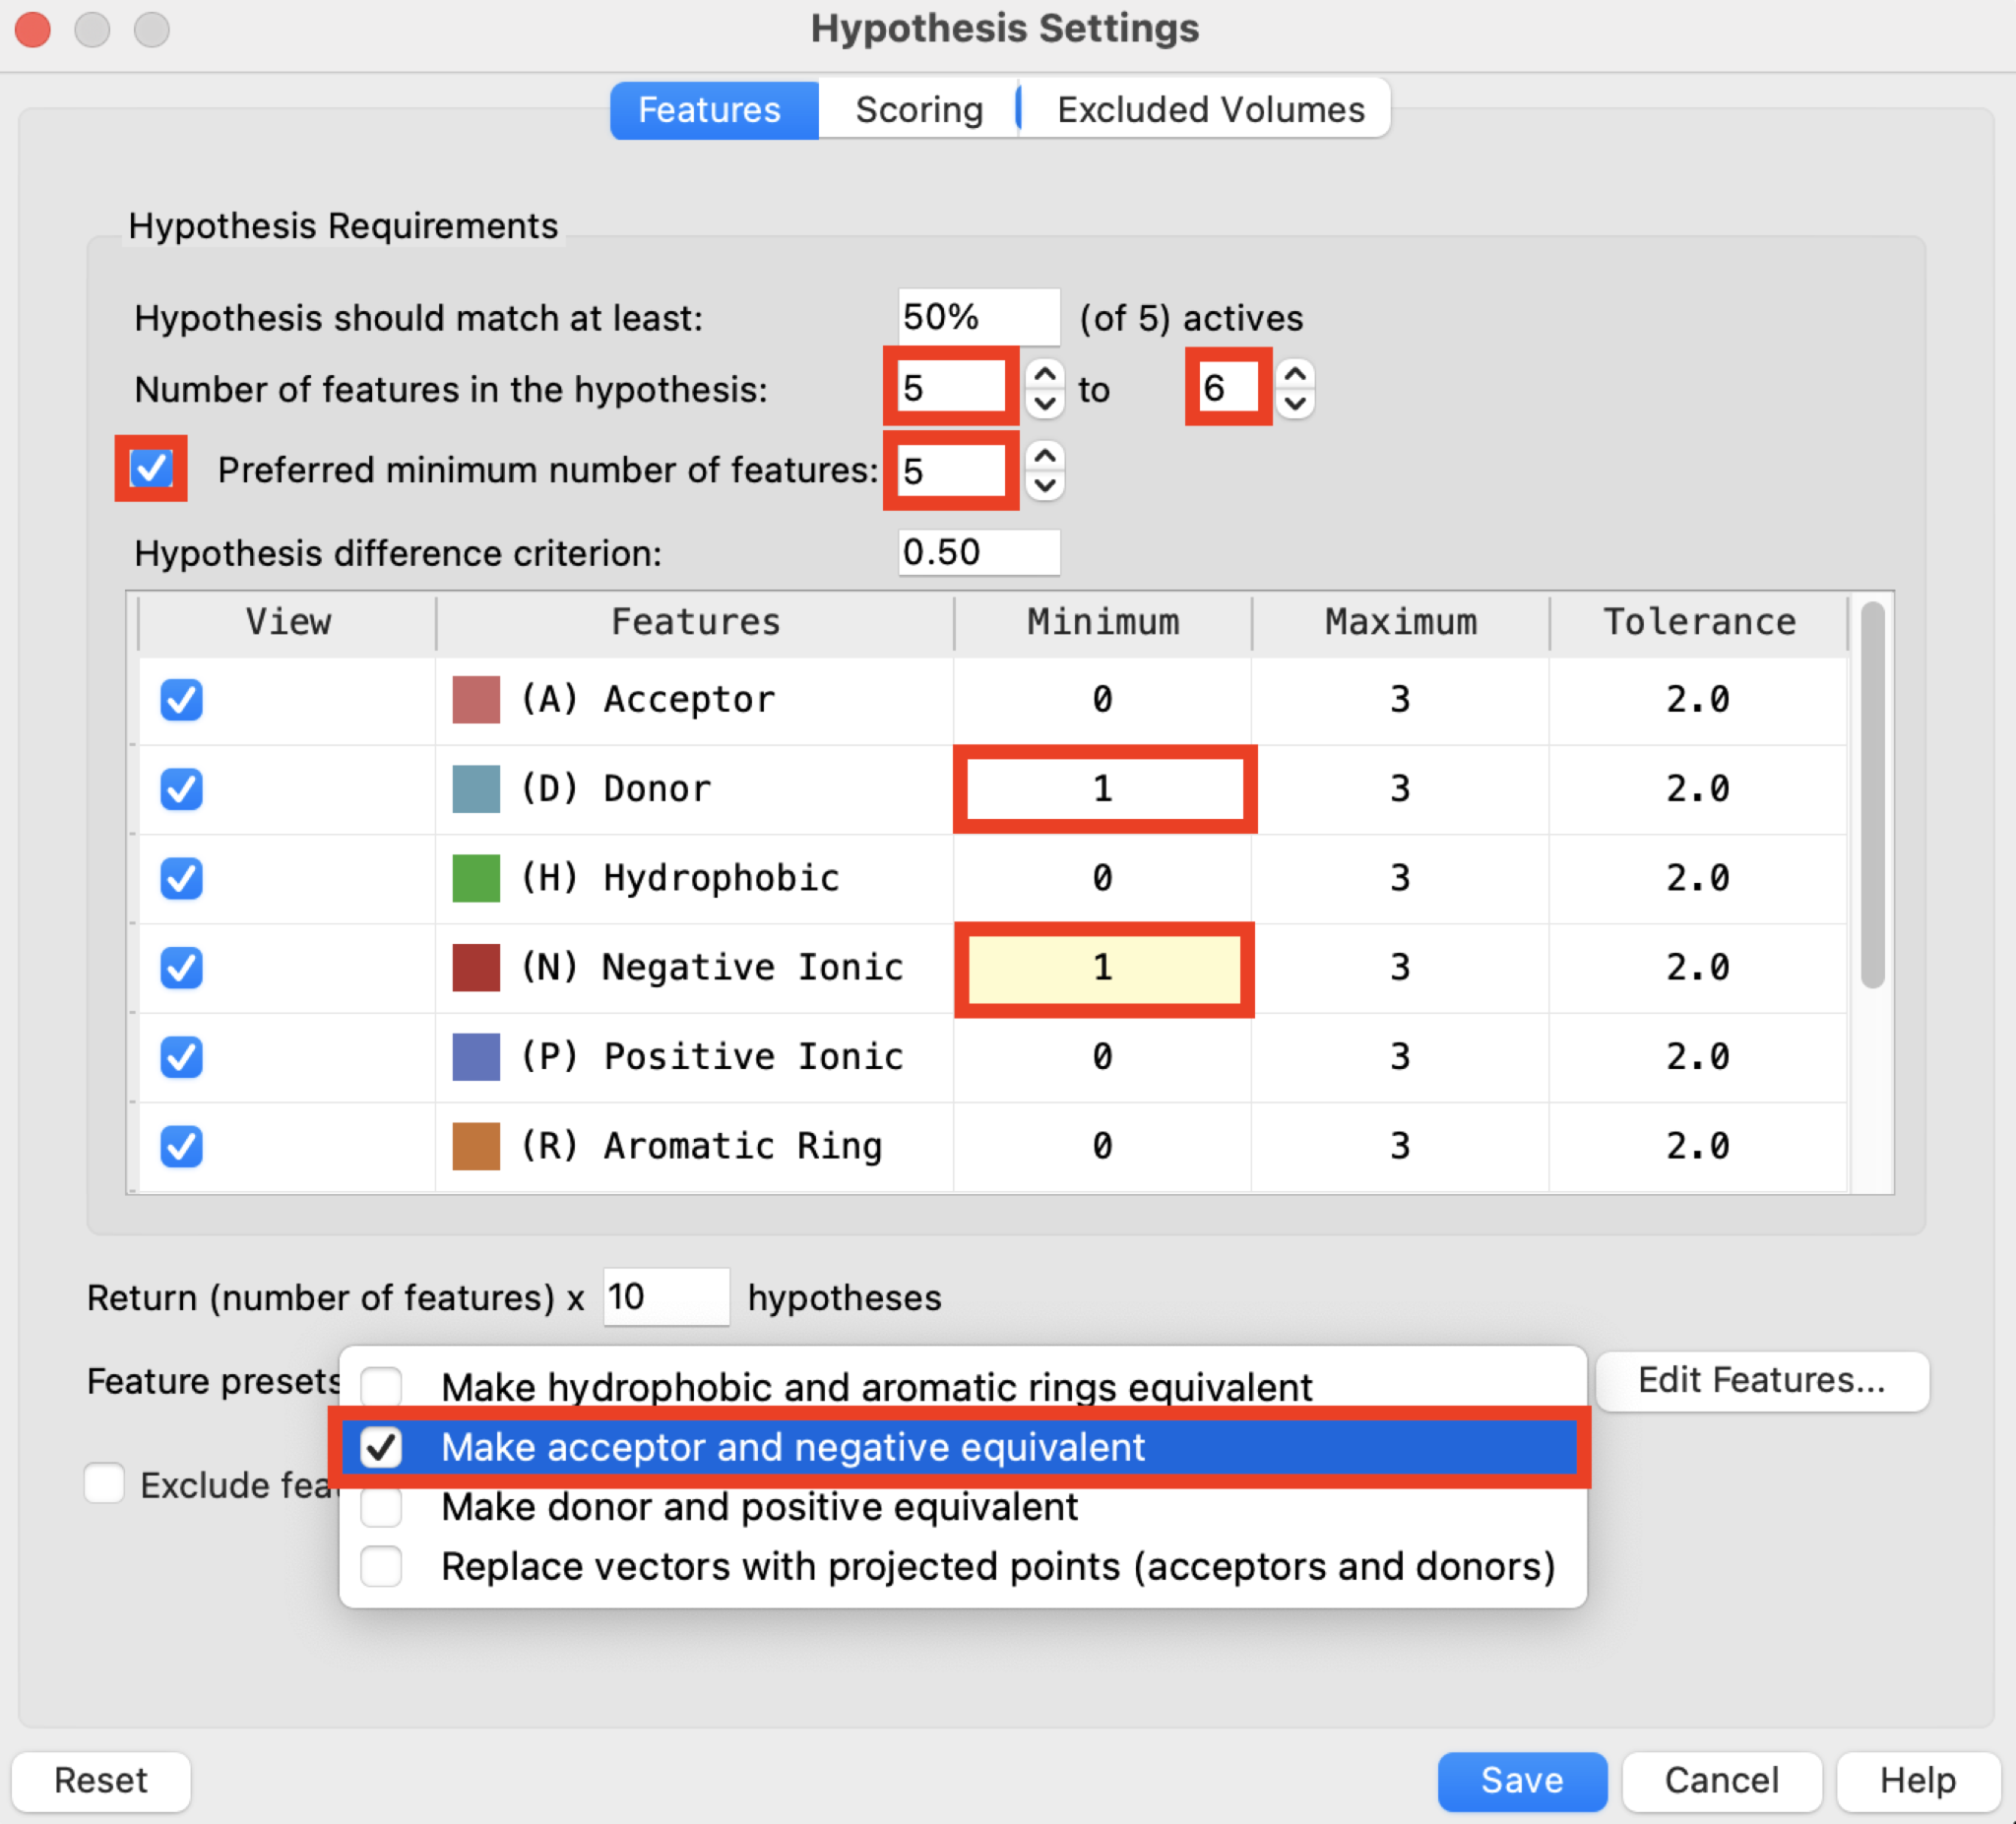
Figure 3-4. Features tab in the Hypothesis Settings panel.
In the Develop Pharmacophore Model panel, under Pharmacophore method, click Hypothesis Settings
In the Features tab, set Number of features in the hypothesis to 5 to 6
- Specify the range in the number of features in the hypothesis. A larger range produces more hypotheses. Providing a range allows the optimum number to be determined in the search by the scoring. A setting of 4 to 6 is usually appropriate.
Check Preferred minimum number of features and set to 5
In the Minimum column, set (D) Donor to 1 and (N) Negative to 1
For Feature presets, choose Make acceptor and negative equivalent
The remaining settings can be left at their default values
Hypothesis should match at least N of M actives text box: Specify the percentage of the actives that should match the hypothesis. The number of hypotheses found decreases as you increase the percentage. As it is possible that actives bind in different modes, a specific hypothesis might not cover all of the actives. For example, a receptor might have a donor with two hydrogens, and one active binds through one hydrogen, another binds through the other hydrogen.
Hypothesis difference criterion text box: Specify the cutoff for determining when two hypotheses are considered to be the same. To determine whether two hypotheses of the same composition (e.g. ADHRR) are the same, they are aligned in every possible configuration. The maximum distance between any two corresponding sites is determined for each configuration. If the smallest value of the maximum distance in any configuration is less than the value specified in this text box, the hypotheses are considered to be the same (redundant). The hypothesis with the best survival score is kept and the other is discarded. If they are not redundant, the new hypothesis is inserted in the ranked list of hypotheses.
The Exclude features from hypothesis option allows you to mask out any features that you do not want to see in the Phase hypothesis. This can be used to mask features in a conserved core to force the common pharmacophore perception to focus on more variable regions of a series.
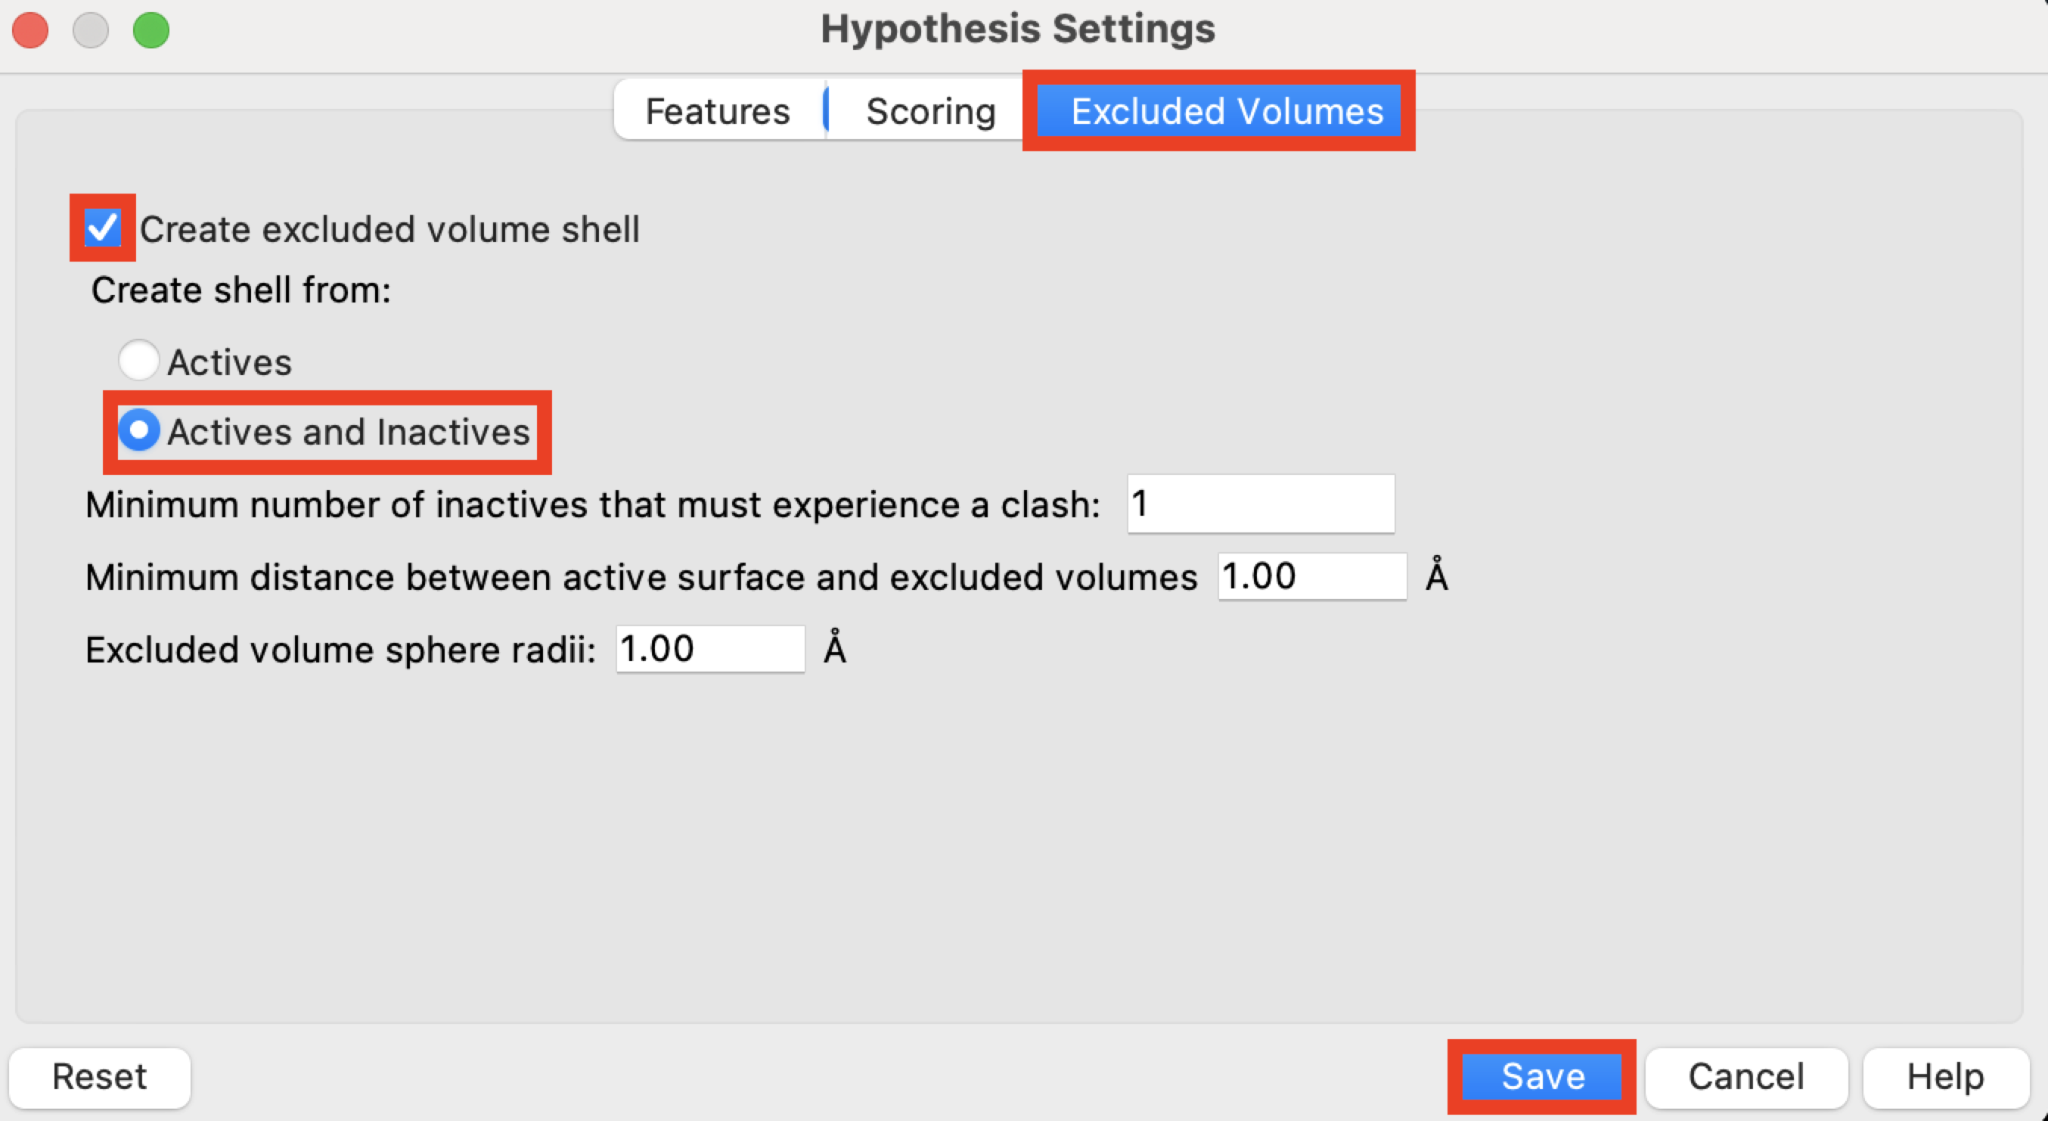
Figure 3-5. Excluded Volumes tab in the Hypothesis Settings panel.
Click the Excluded Volumes tab
Check Create excluded volume shell
Under Create shell from, choose Actives and Inactives
Note: See Phase Help for more information on the creation of excluded volumes from inactives and actives
- Click Save
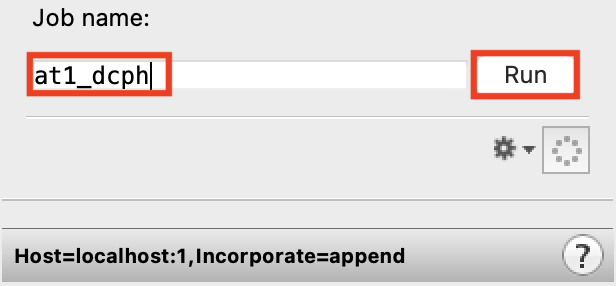
Figure 3-6. Change Job name.
In Develop Pharmacophore Model, change the Job name to at1_dcph
Click Run
Close the Develop Pharmacophore Model panel
Note: To save time, we will look at pregenerated results
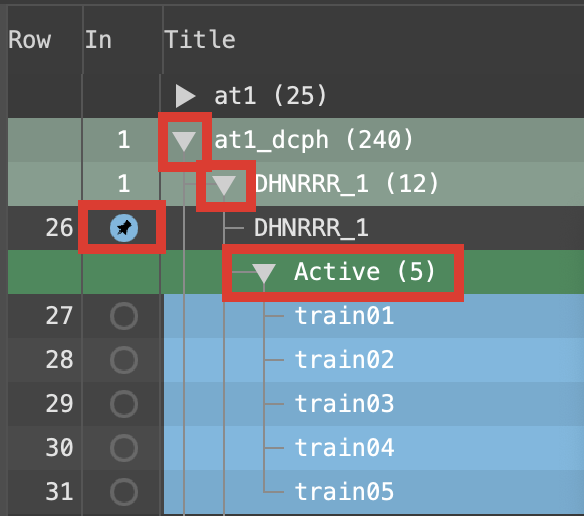
Figure 3-7. Project Table of Hypothesis DHNRRR_1 Actives expanded.
- Expand the group at1_dcph
Note: Hypotheses are named according to their features, e.g. APRR has an acceptor, a positive ionic, and two ring features
Expand group DHNRRR_1
Double-click the DHNRRR_1 In circle to fix the hypothesis in the Workspace
Select the Active group
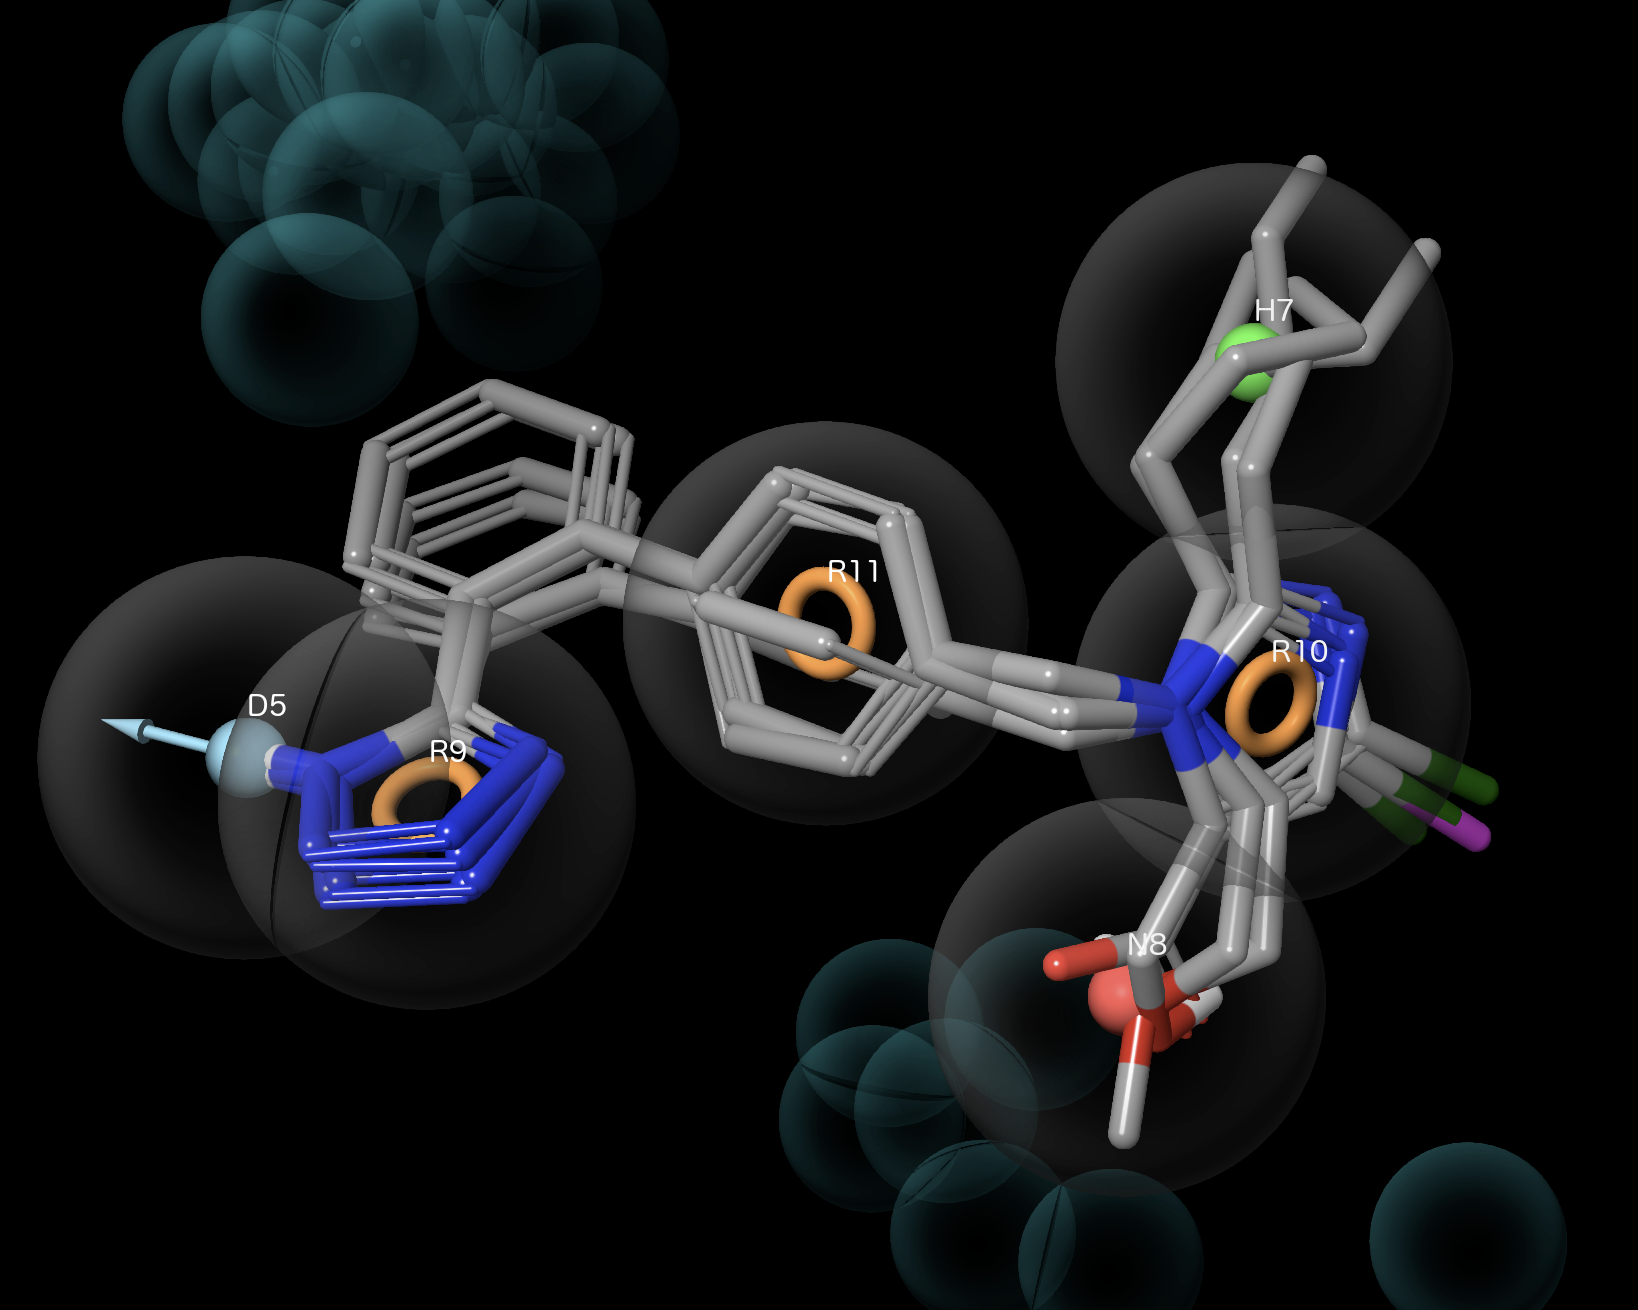
Figure 3-8. Active group and DHNRRR_1 Hypothesis.
- Use shift-click to include all ligands in the Active group
Active ligands have good feature alignment
Active ligands avoid excluded volumes
- Right-click Active group and choose Exclude
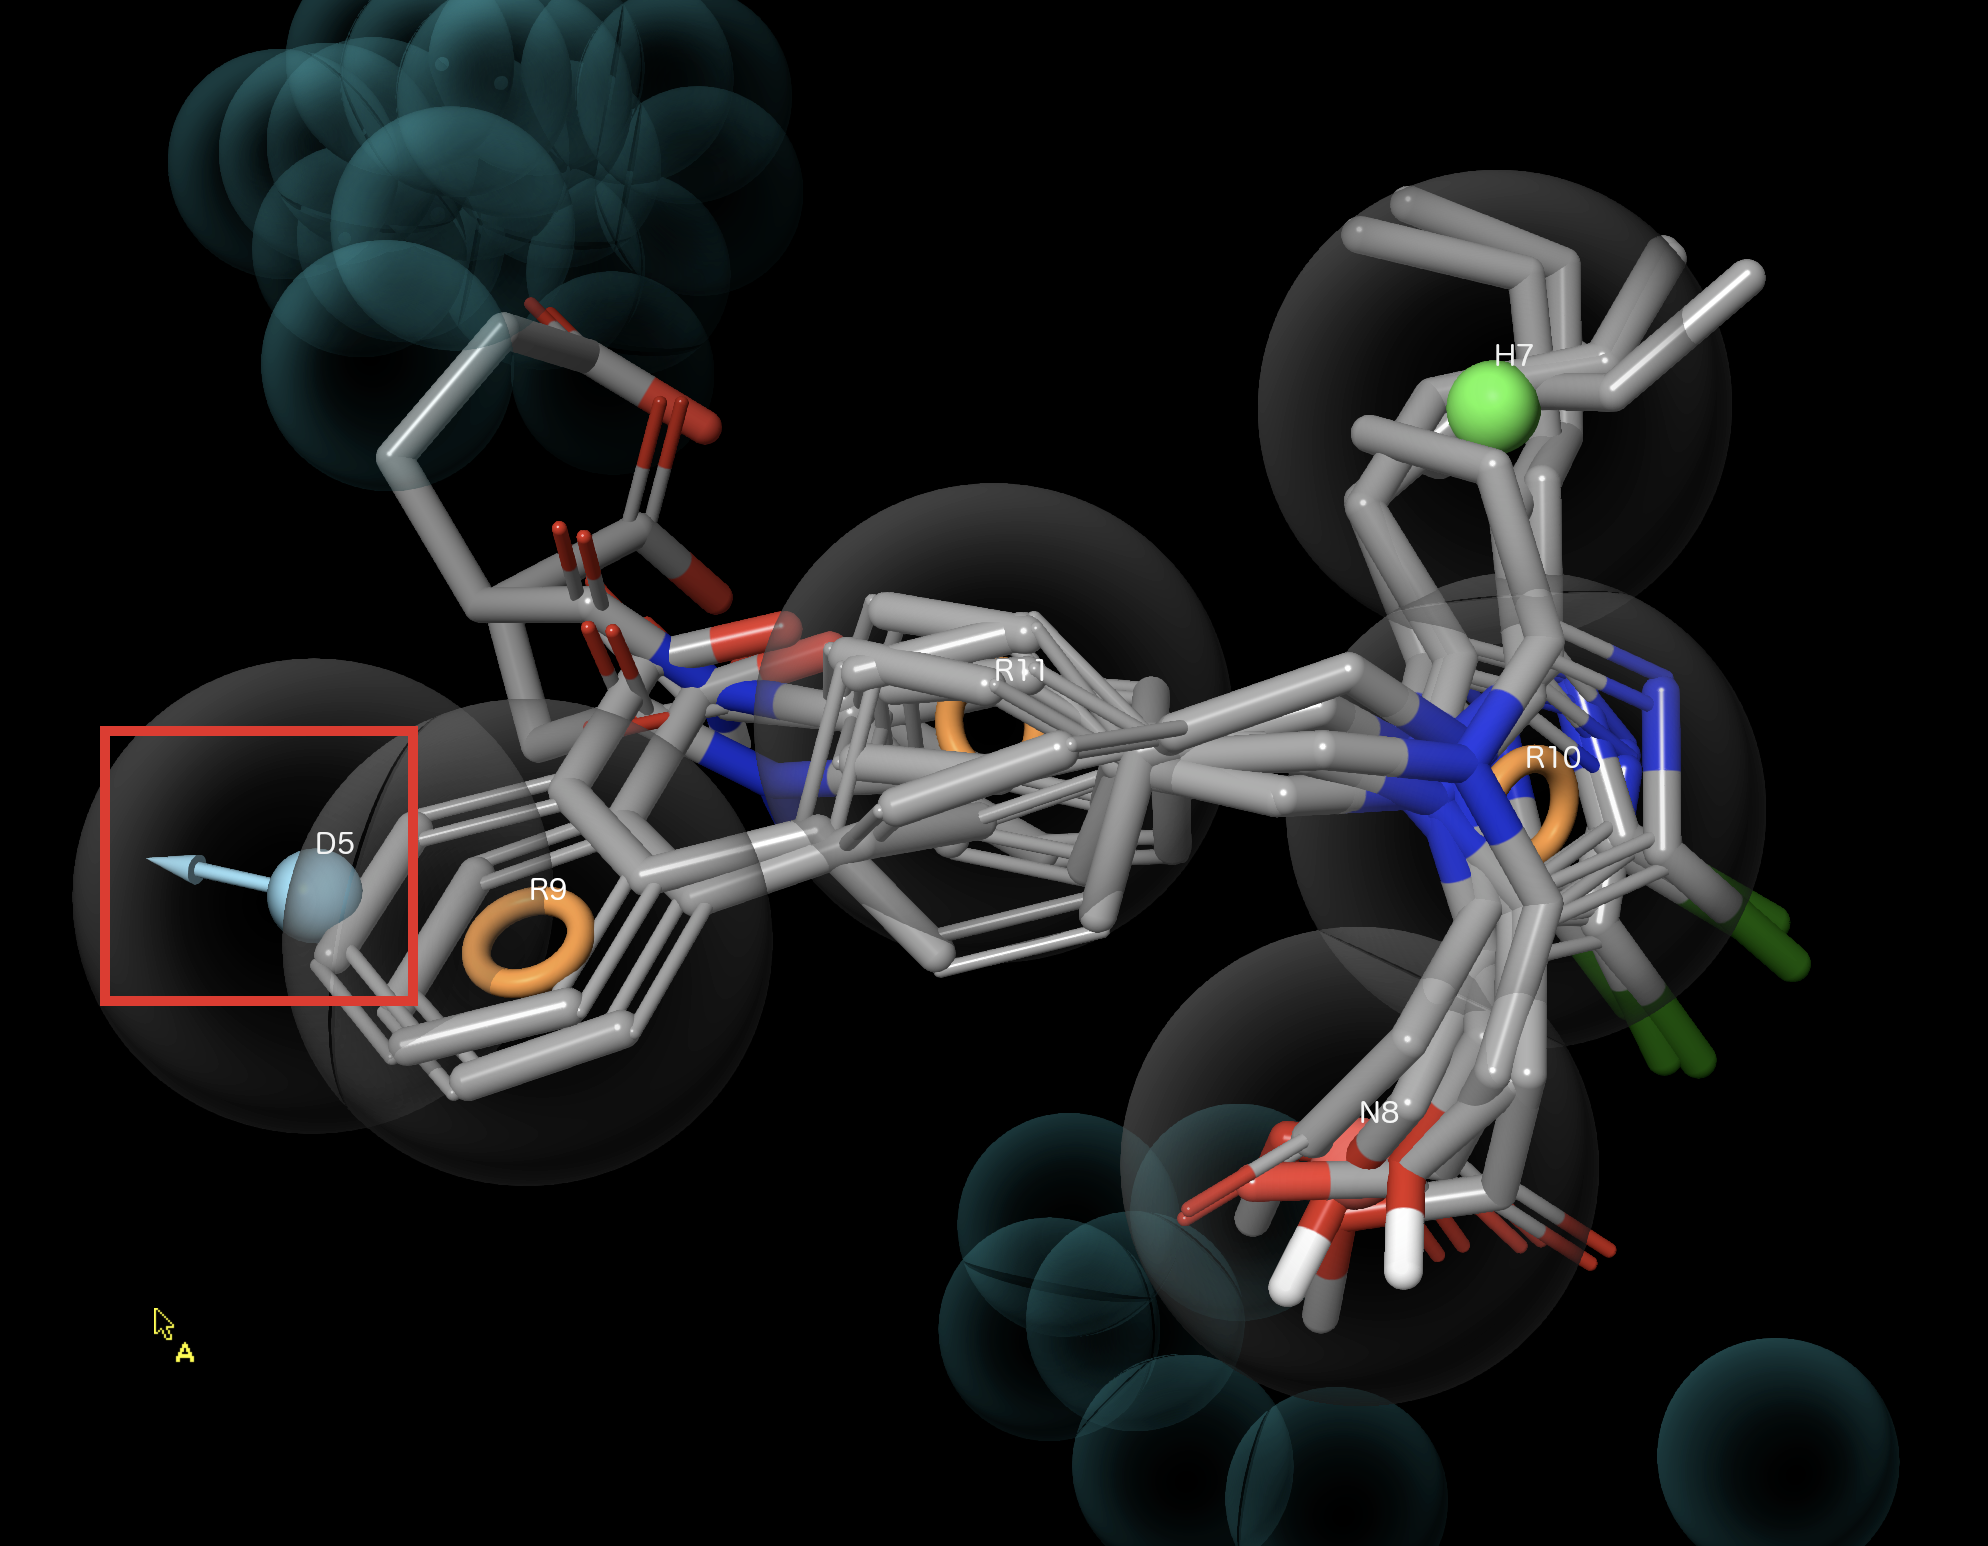
Figure 3-9. Inactive ligands and hypothesis DHNRRR_1.
Select the Inactive Partial Match group
Right-click the Inactive Partial Match group and choose include
Inactive ligands have poor feature alignment (e.g. D5)
Inactive ligands clash with excluded volumes
Right-click Inactive Partial Match group and choose Exclude
Double-click the DHNRRR_1 In circle to un-fix the hypothesis
3.2 Measuring the distance between features
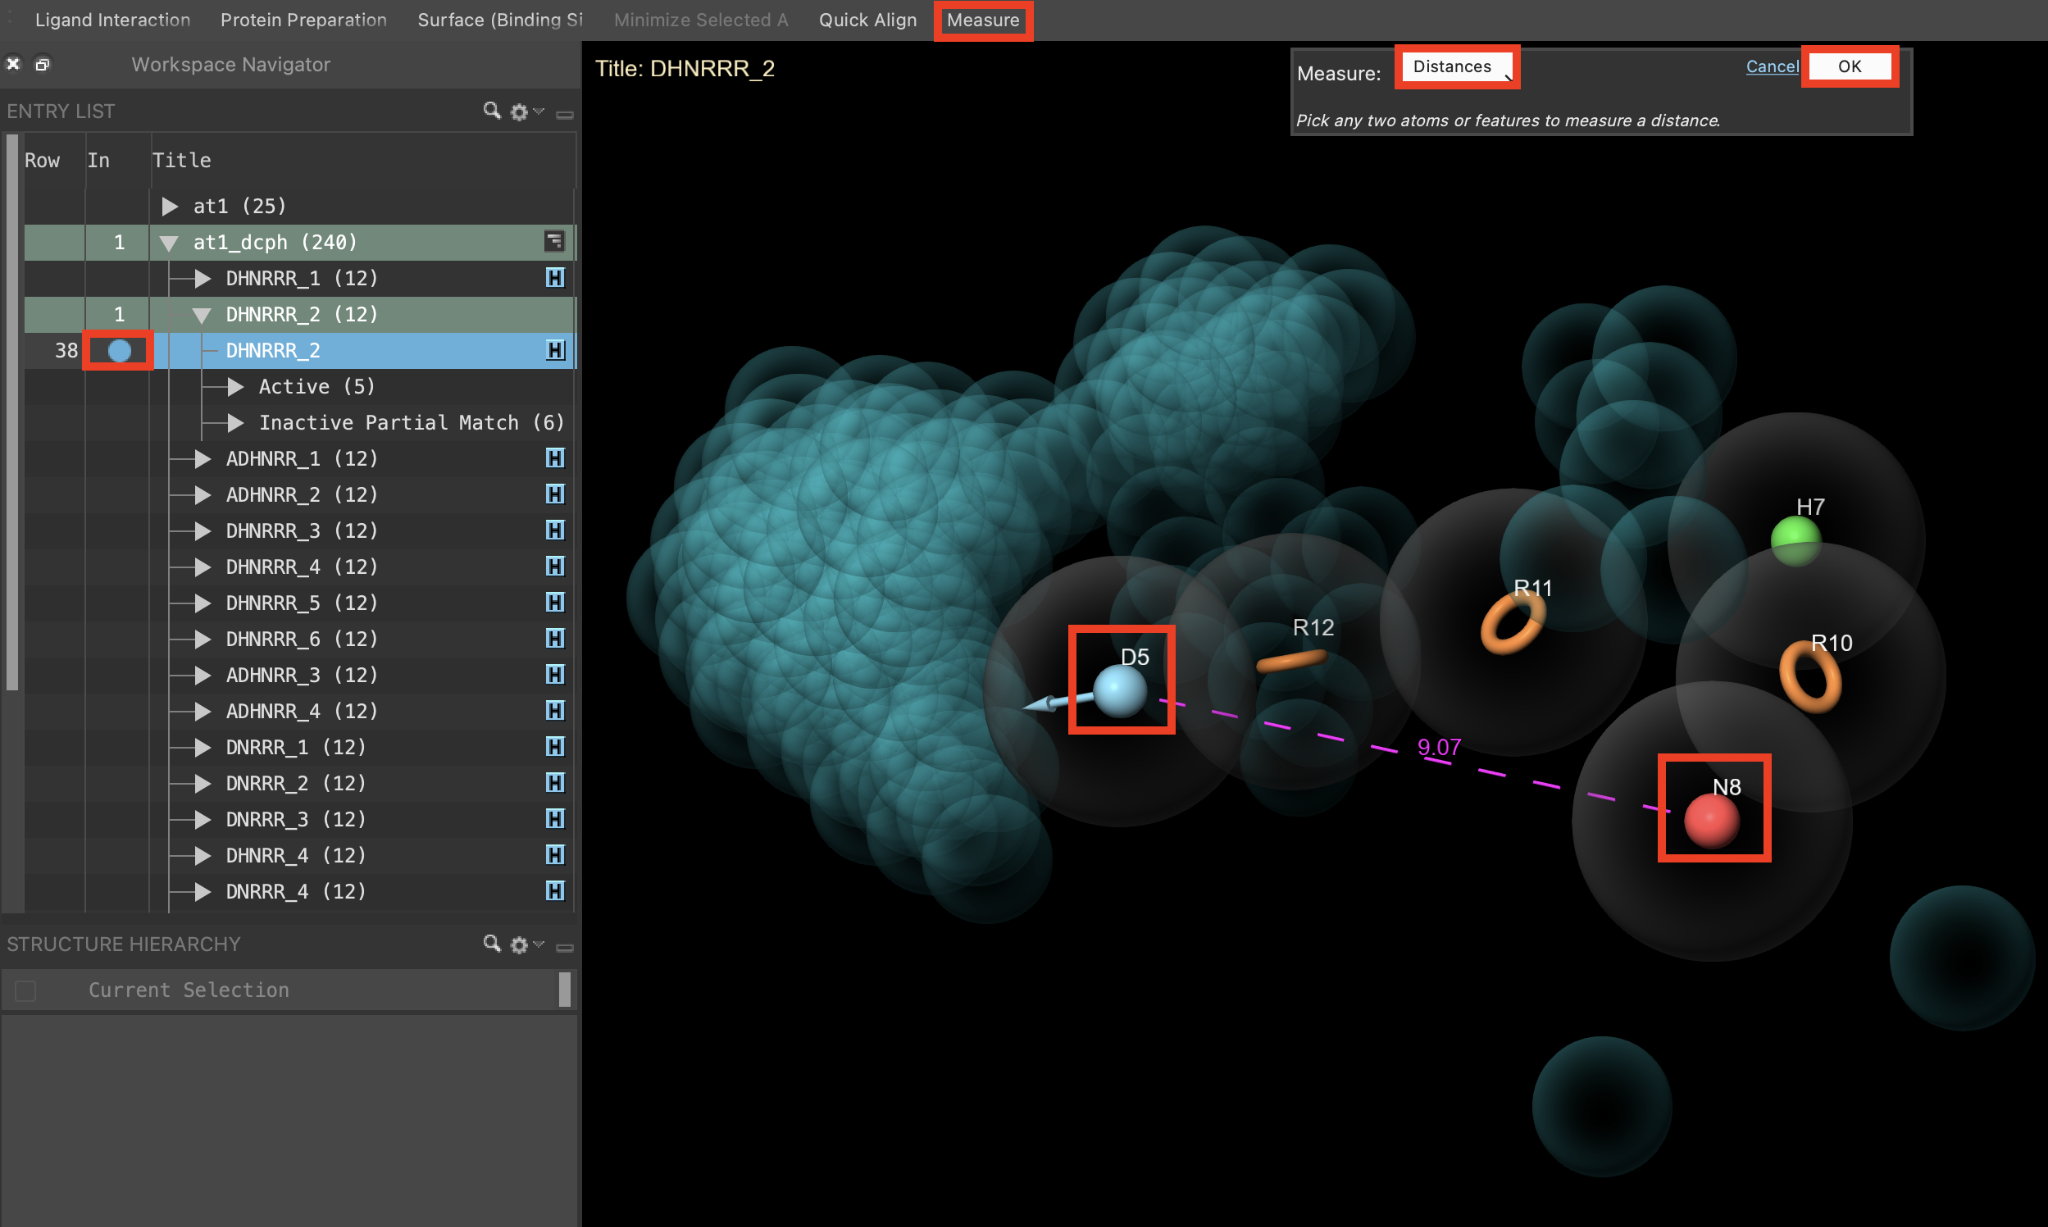
Figure 3-10. Measure distance between pharmacophore features
Include the DHNRRR_2 hypothesis in the Workspace
Go to Tasks > Browse > Workspace Operations > Measure
Note: Measure is added to the Favorites Toolbar by default and can be easily accessed from there as well
For Measure, choose Distance
Select N8 and D5 in the Workspace
- A line appears connecting the two features with a label noting the distance between them
Click Ok to close the Measurement banner
Right-click the background and choose Clear Workspace from the menu
Measurements can be tracked by hovering over the measurement icon in the Workspace Configuration Toolbar and clicking the …
4 Creating a Phase Database
In this section, we will create a Phase database for a collection of ligands. Screening compounds from a prepared Phase database is ~2-3 times faster than screening compounds from files or the Entry List. By default, compounds in Phase databases include low-energy ionization/tautomeric states and an ensemble of low-energy conformers. These compounds are ready for use in docking with Glide, shape screening with Shape, and pharmacophore querying with Phase. Compounds can be screened against one or more pharmacophore hypotheses from one or more Phase databases in one calculation.
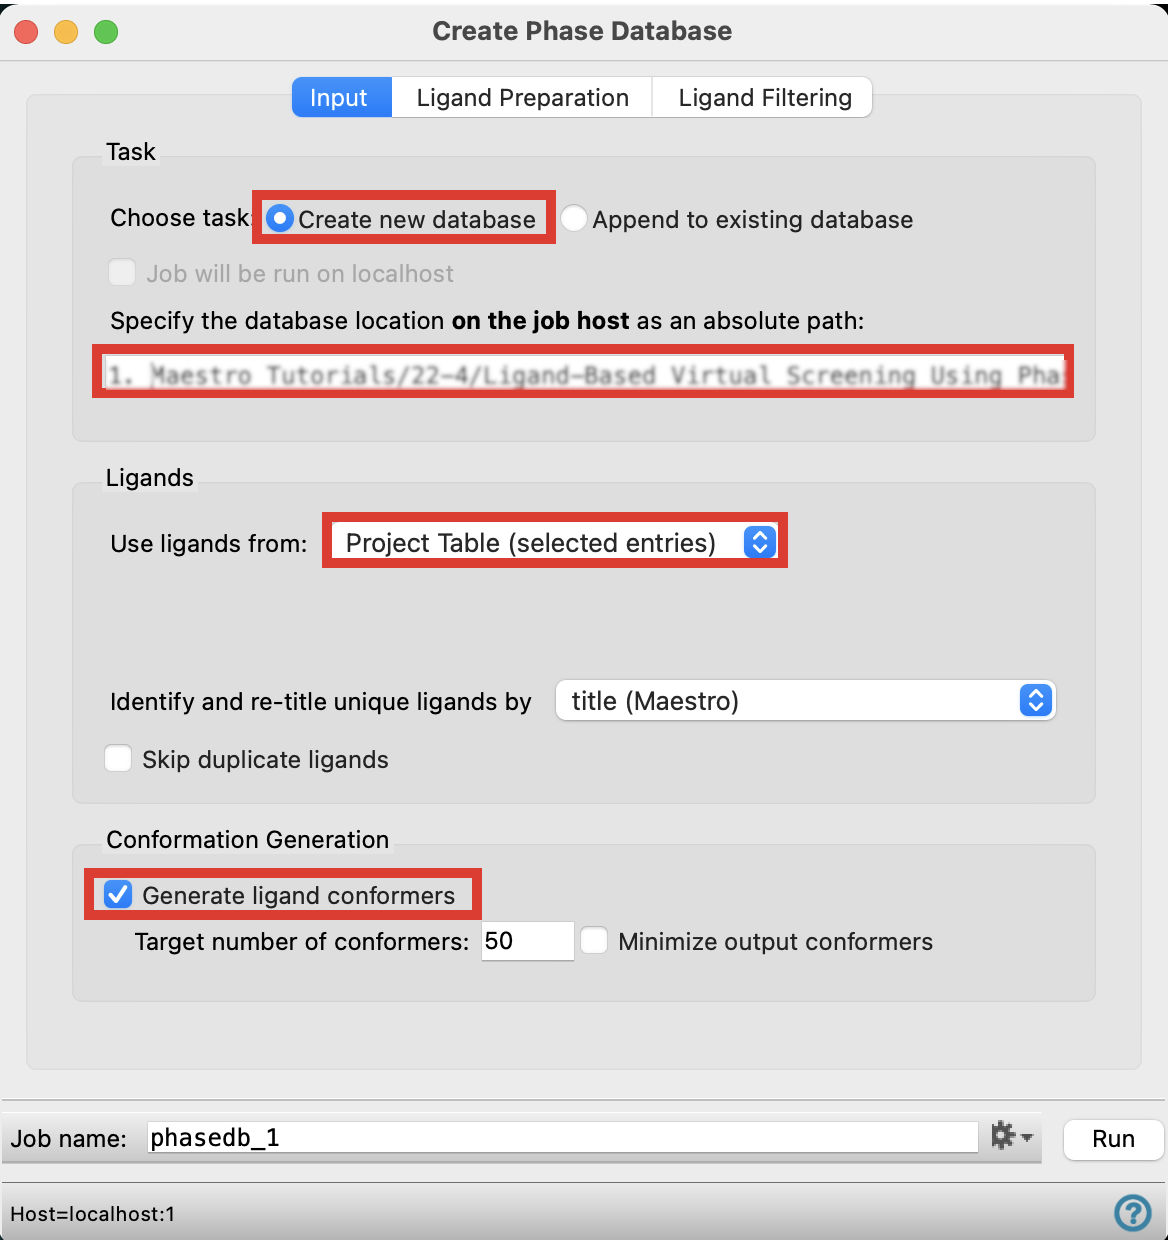
Figure 4-1. Input tab in the Create Phase Database panel.
In the Entry List, select DUD-E_act_3chp_trainc
Navigate to Tasks > Browse > Ligand-Based Virtual Screening > Create Database
- The Create Phase Database panel opens
In the Input tab, next to Choose task, pick Create new database
Specify the database location on the job host by writing a file path
- Please note that the file path must begin with a backslash “ / ”
For Use ligands from, choose Project Table (selected entries)
Under Conformation Generation, check Generate ligand conformers
DUD-E is the ‘Database of Useful Decoys: Enhanced.’ For each active in the database, there are 50 decoys with similar 1-D physio-chemical properties, but different 2-D topology. DUD-E ligand set can thus be used in pharmacophore screening to avoid artificial enrichment
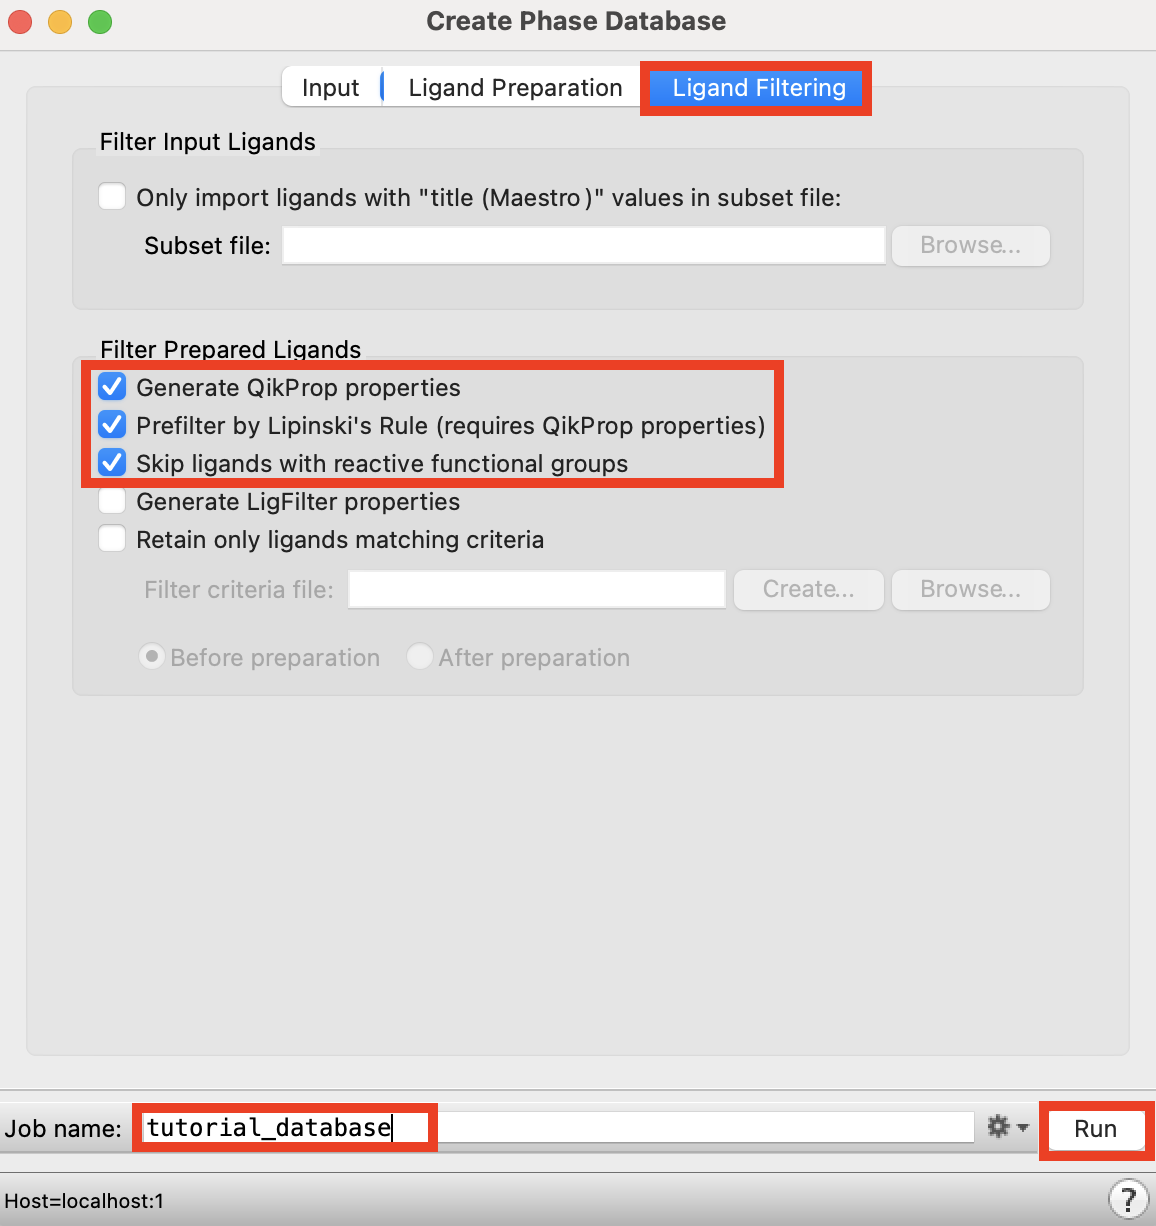
Figure 4-2. Ligand Filtering tab in the Create Phase Database panel.
Click the Ligand Filtering tab
Under Filter Prepared Ligands, check the first three options
Change the Job name to tutorial_database
Click Run
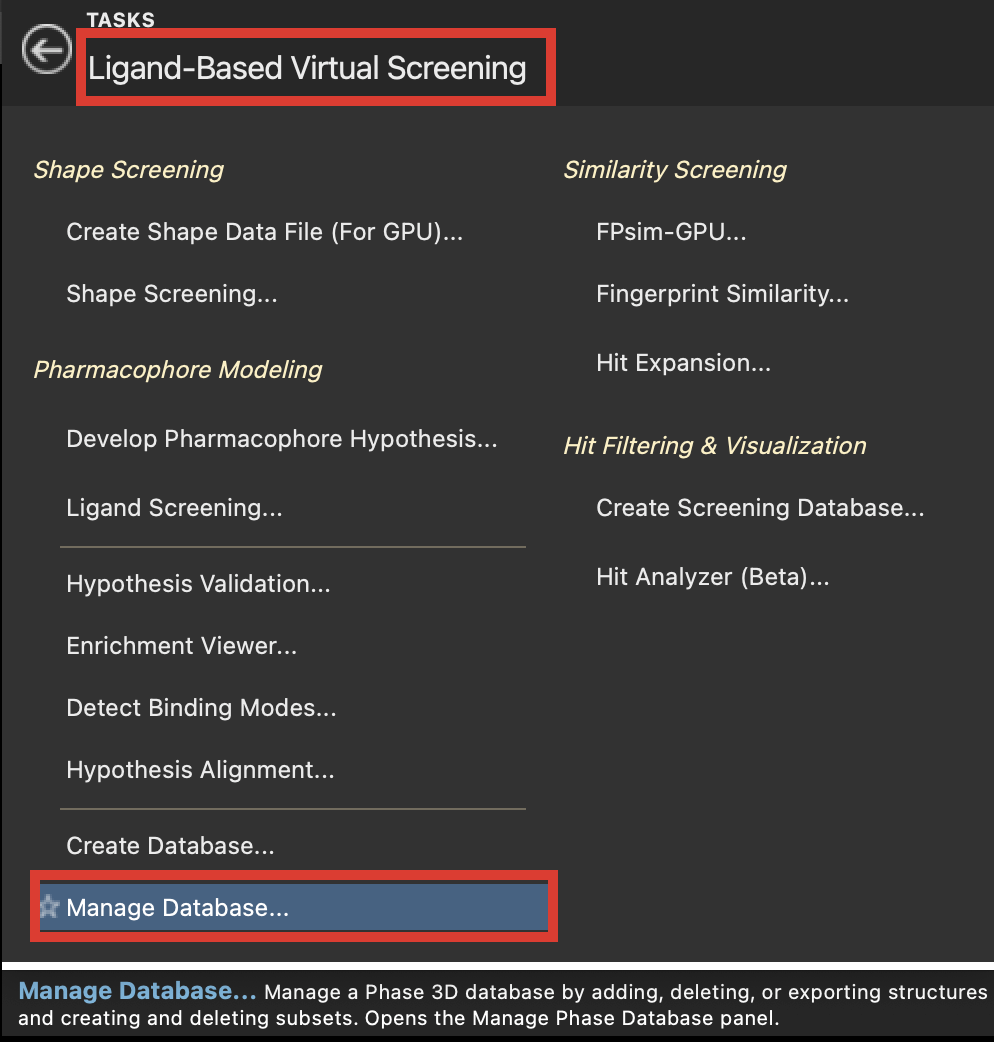
Optional: Go to Tasks > Browse > Ligand-Based Virtual Screening > Manage Database to view ligands generated in a Phase Database
Note: No licenses are checked out during the creation or modification of a Phase database, enabling the calculation to be distributed over as many CPUs as are available without running out of licenses
5 Screening a Phase Database against Pharmacophore Hypotheses
In this section, we will cover options for screening ligands from a Phase Database against hypotheses. We will then visualize the results and examine the PhaseScreenScore to evaluate how well the ligands align to the pharmacophore features of the hypothesis it was screened against.
5.1 Screen ligands from a Phase Database
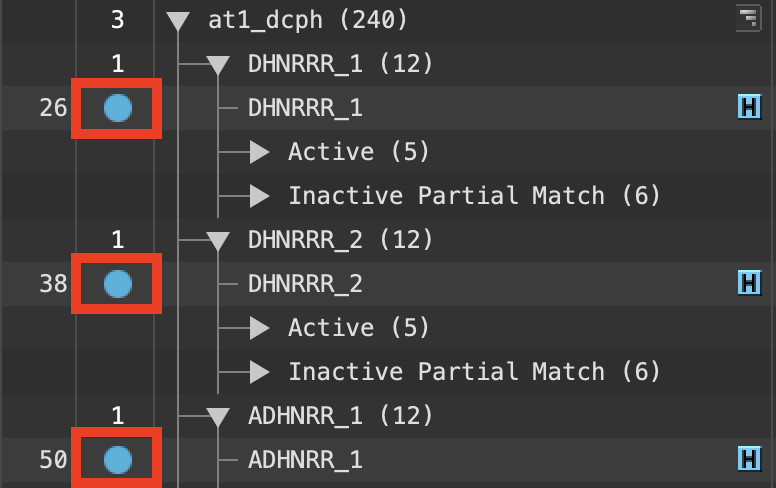
Figure 5-1. Entry List inclusion.
- In the Entry List, Ctrl-click (Cmd-click) to Include the top hypotheses from the at1_dcph group, ADHNRR_1, DHNRRR_2, and DHNRRR_1
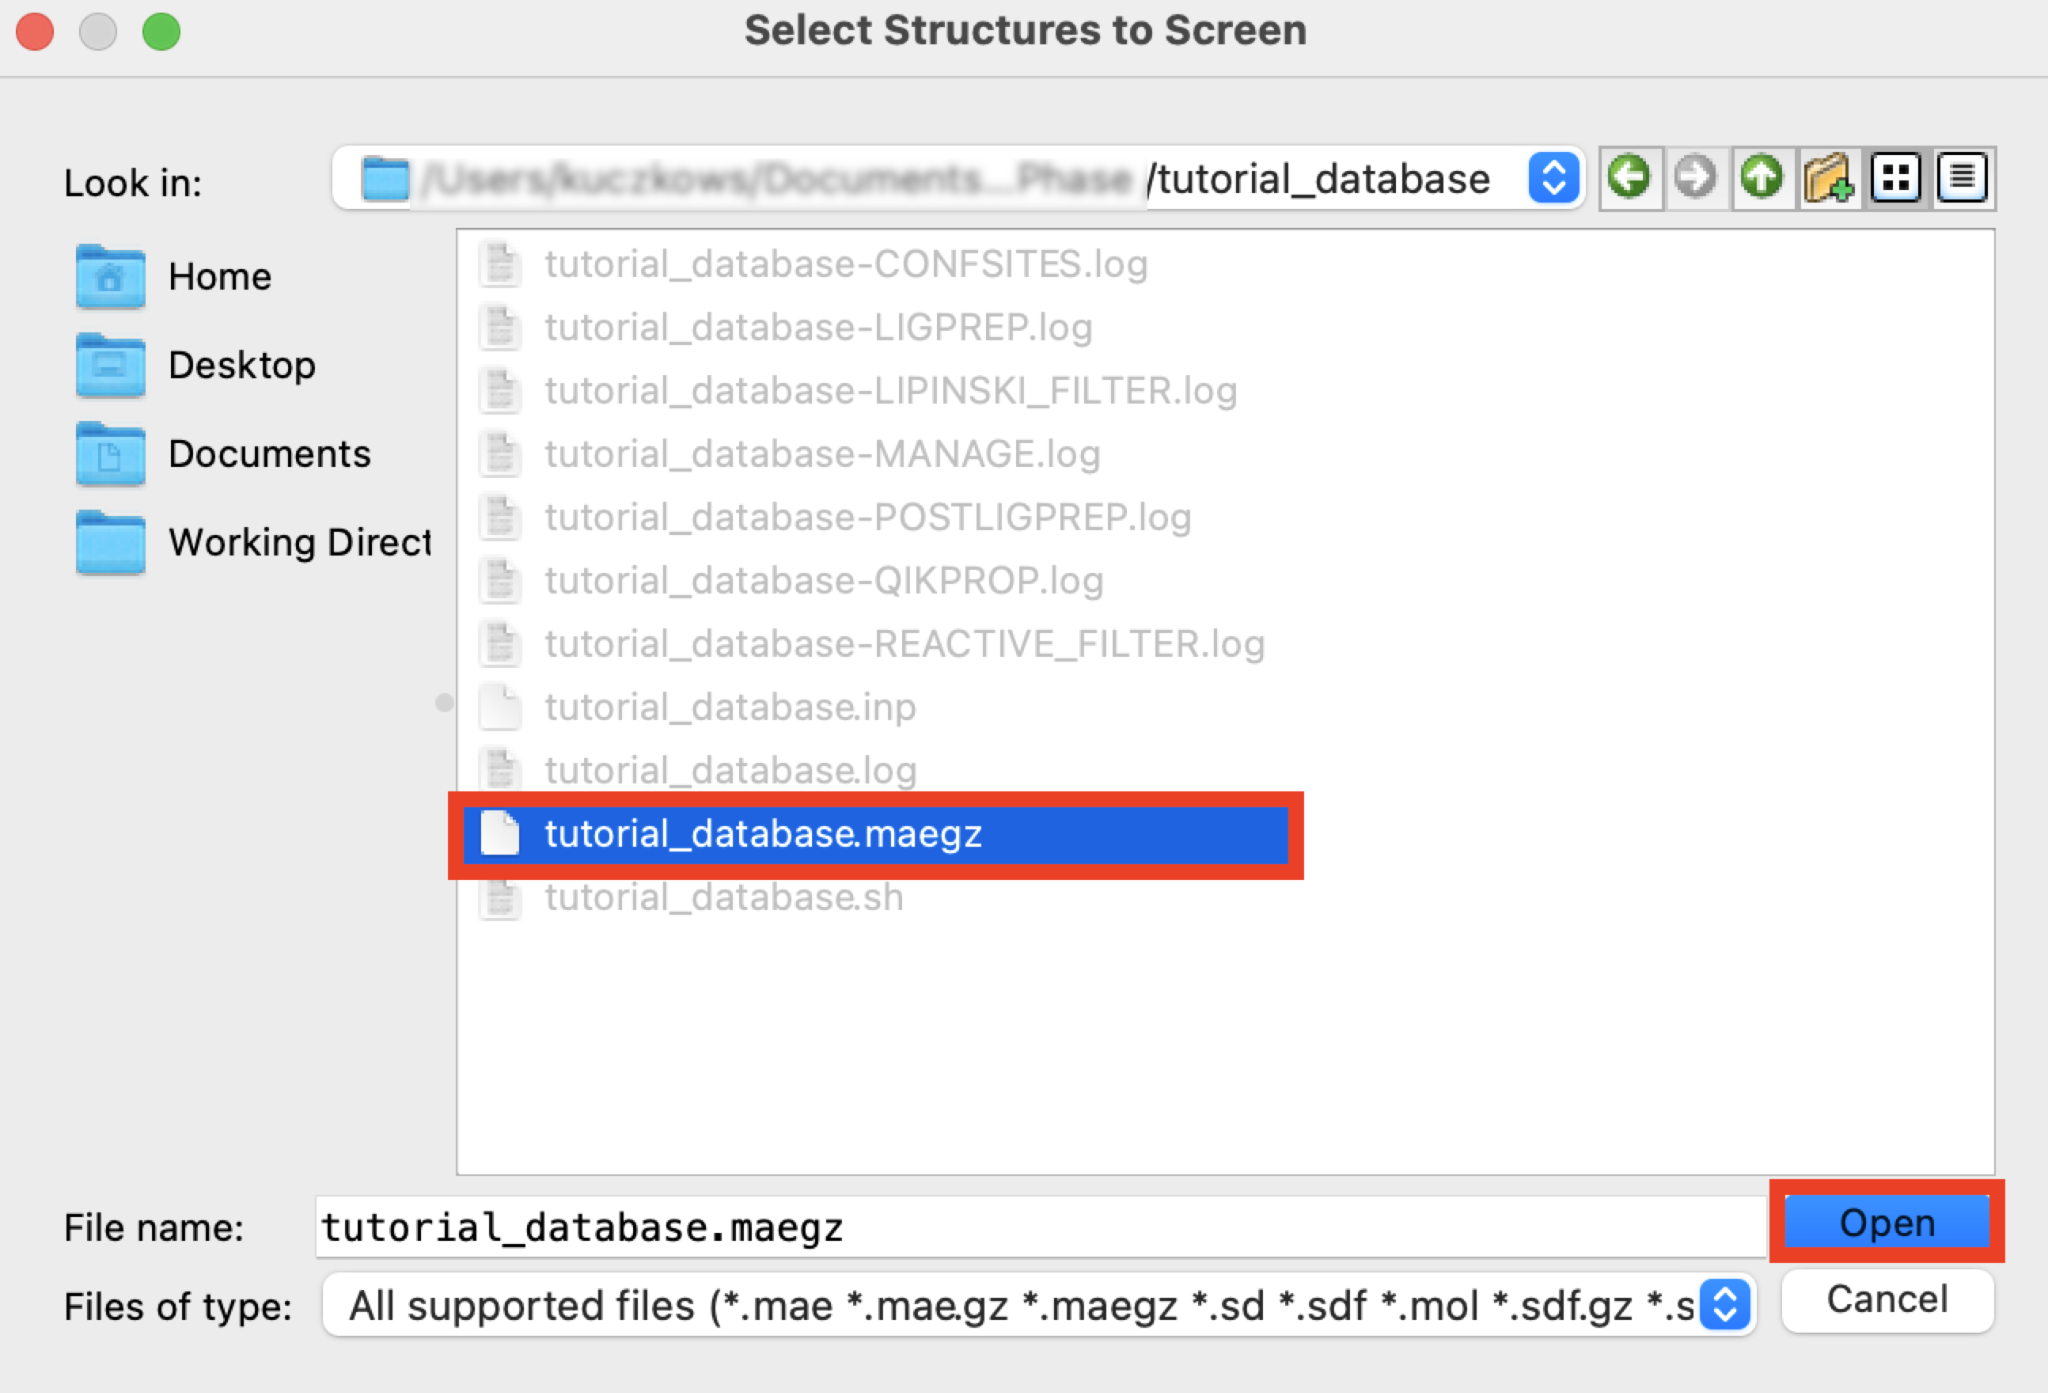
Figure 5-2. Open Phase Database panel.
Go to Tasks > Browse > Ligand-Based Virtual Screening > Ligand Screening
For Ligands to screen, choose File
Click Browse
Select the file
tutorial_database.maegz
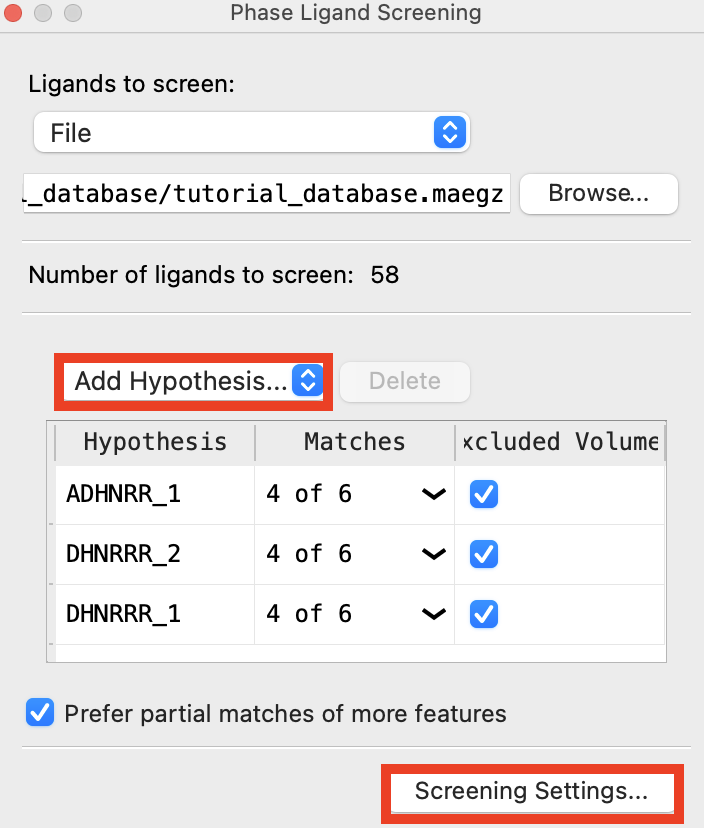
Figure 5-3. Add hypotheses to Phase Ligand Screen.
Click Add Hypothesis
Choose Workspace
Right click on the Workspace > Clear Workspace
Click Screening Settings
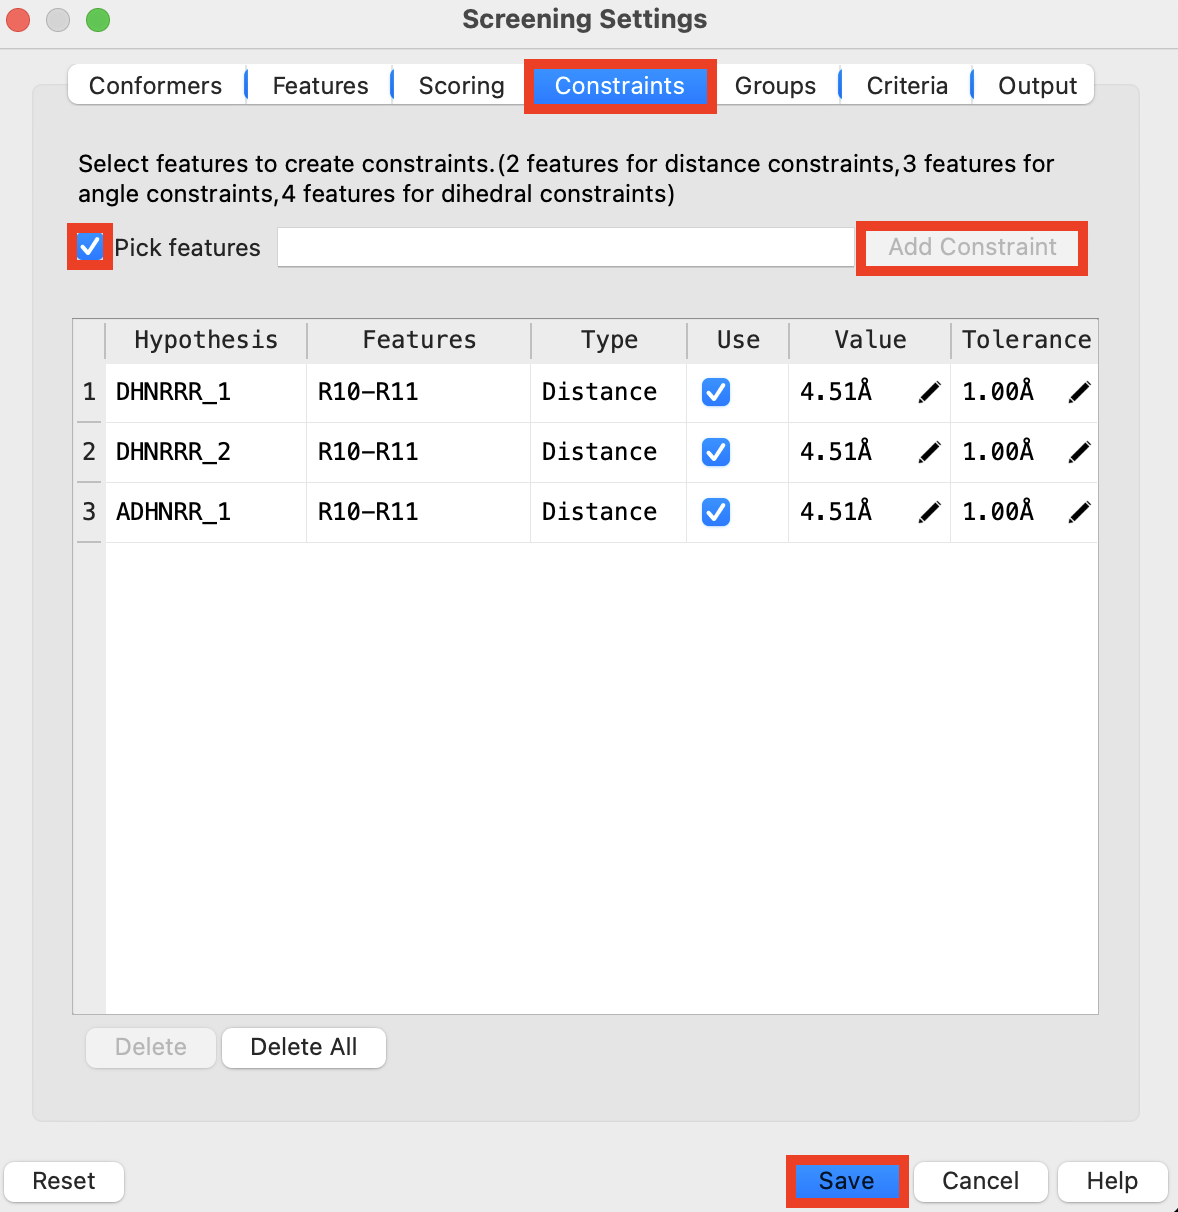
Figure 5-4. Add Constraints to Phase Ligand Screen
Go to the Constraints tab
Check Pick Features
Include only DHNRRR_1
Select Features R10 and R11 in the Workspace using ctrl/cmd-click
Click Add Constraint
Note: The constraint value and tolerance can be edited manually
Repeat steps 12-14 for DHNRRR_2 and AHNRRR_1
Click Save
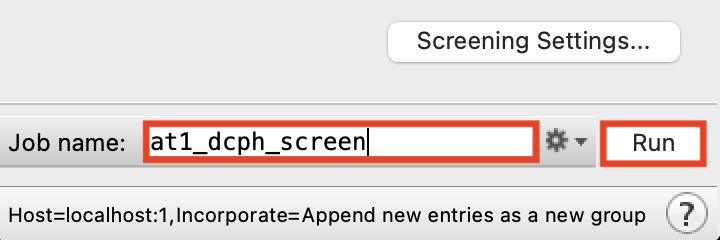
Figure 5-5. Change Job name.
Change the Job name to at1_dcph_screen
Click Run
Close the Phase Ligand Screening panel
Note: Although this job is fast, the results are already present in your project if you choose to use them instead of running the job yourself.
5.2 Visualize pharmacophore screening results
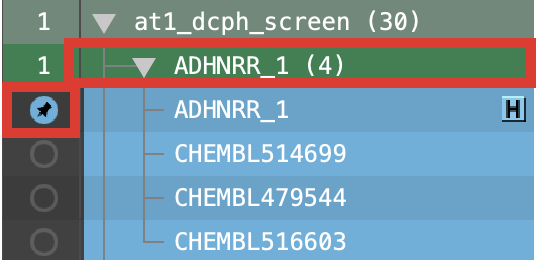
Figure 5-6. Phase Database screening results visualized with the corresponding hypothesis.
Expand the at1_dcph_screen group and the AHNRRR_1 group
Double-click the In circle to fix the AHNRRR_1 hypothesis in the Workspace
Select the AHNRRR_1 group by clicking on the header
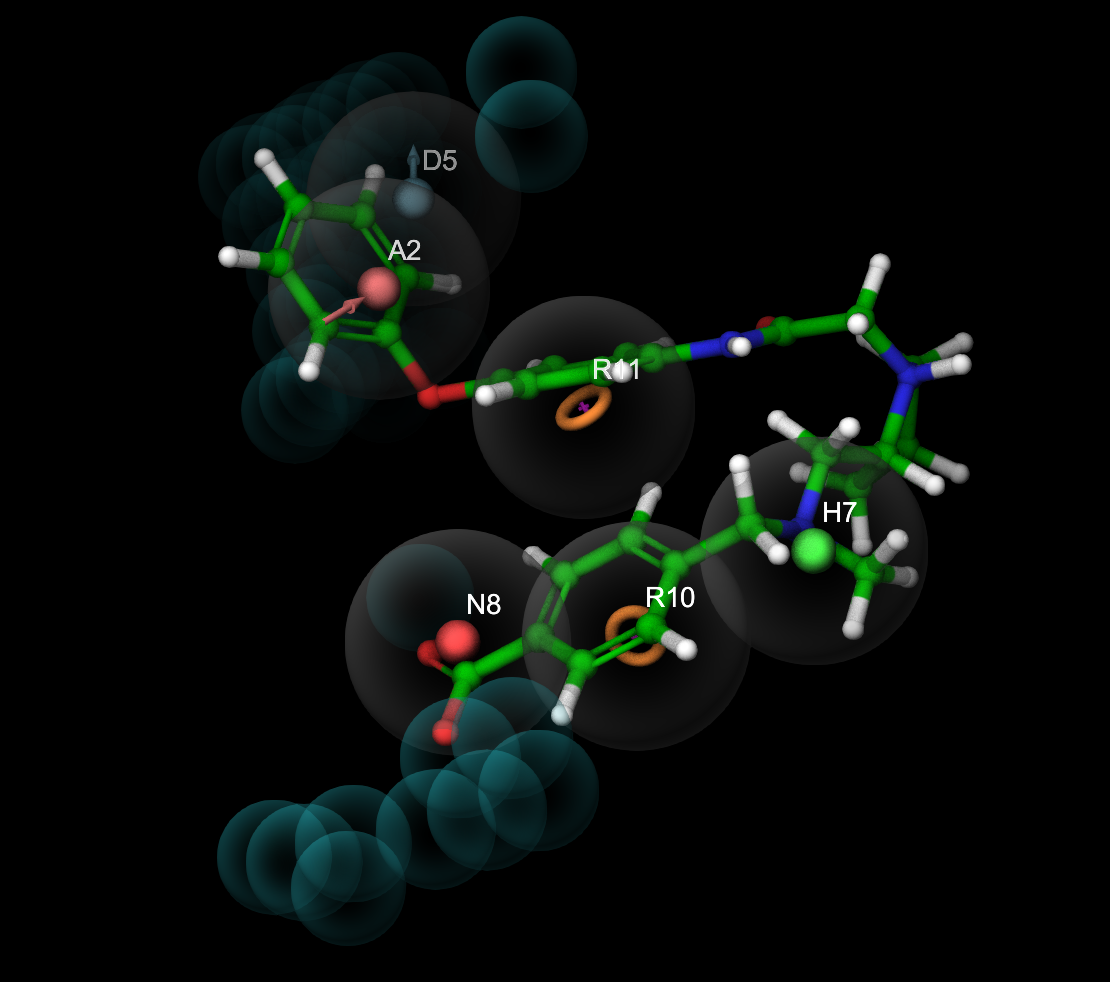
Figure 5-7. Ligand screening results visualized with the corresponding hypothesis.
- Use right and left arrow keys to step through the ligands
Optional: Include the AHNRRR_1 group and double-click the Presets button to view the ligands with ball-and-stick styling and unique coloring.
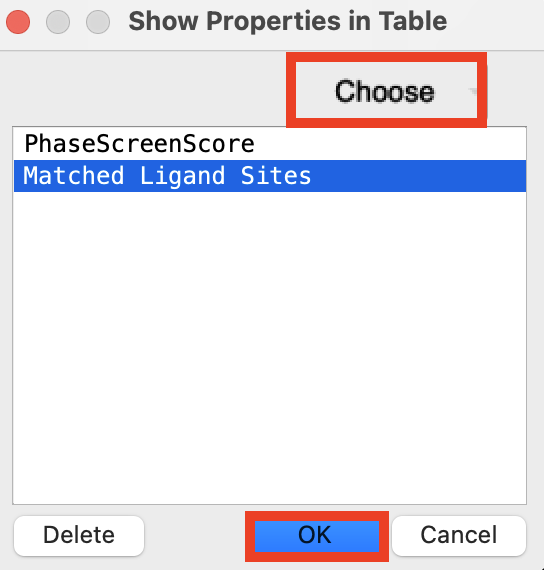
Figure 5-8. Add properties to the Entry List.
At the top right corner of the Entry List, click the Settings button (cog)
Choose Show Property
Click Choose
Type Phase
Select PhaseScreenScore
Click Choose
Type Matched
Select Matched Ligand Sites
Click OK
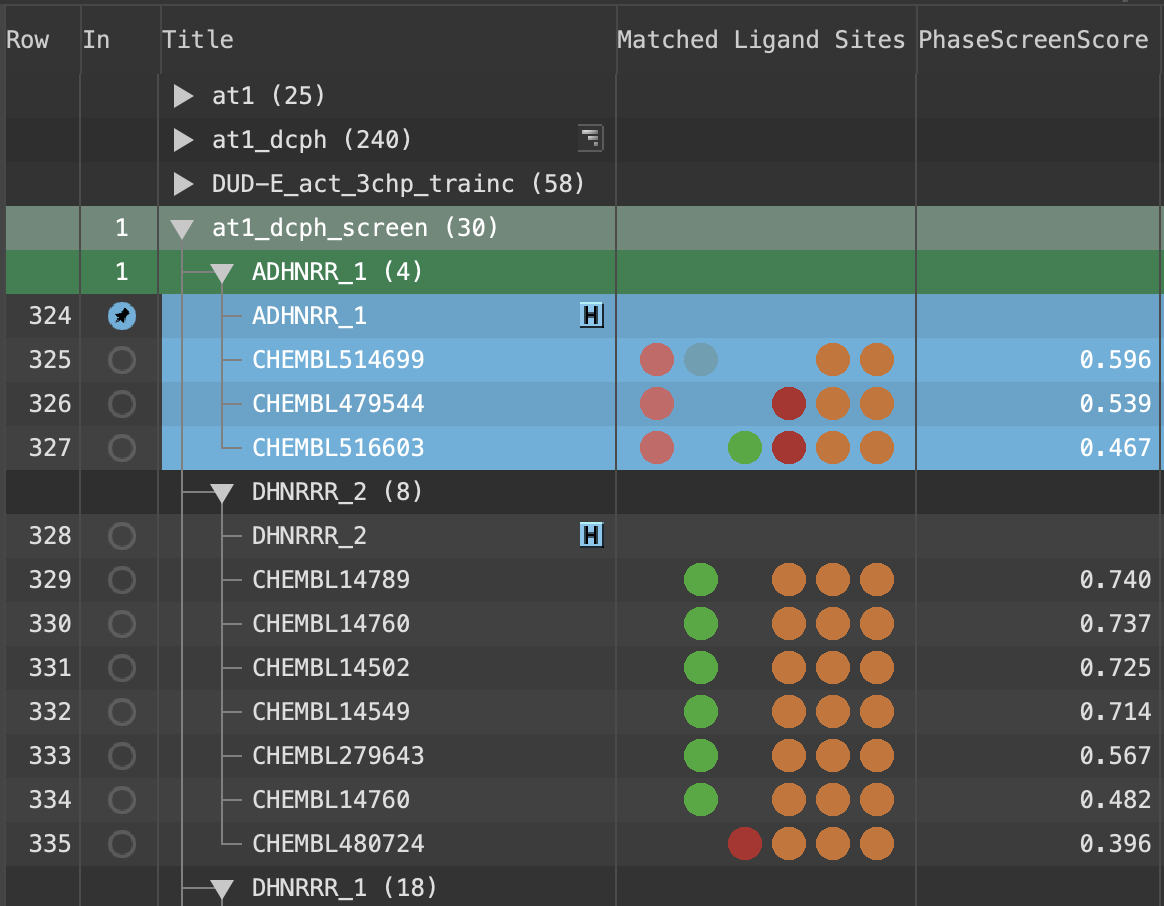
Figure 5-9. Updated Entry List with Matched Ligand Sites and Phase Screen Score.
Note: The above properitis can be found at the Project Table panel by pressing Ctrl+T (⌘T).
Note: Hover over the Matched Ligand Sites circles to see what features are present
Note: Both the quantity and quality of feature matching is taken into account in the PhaseScreenScore. A ligand can thus both match fewer sites and have a higher PhaseScreenScore than another ligand in the screening set
6 Developing Pharmacophore Hypotheses from a Diverse Ligand Set
In this section, we will cover the process of developing a pharmacophore hypothesis. This will also show how to evaluate the quality of the generated hypotheses with PhaseHypoScore, and visualize binding modes.
6.1 Develop common pharmacophore hypotheses from a diverse ligand set
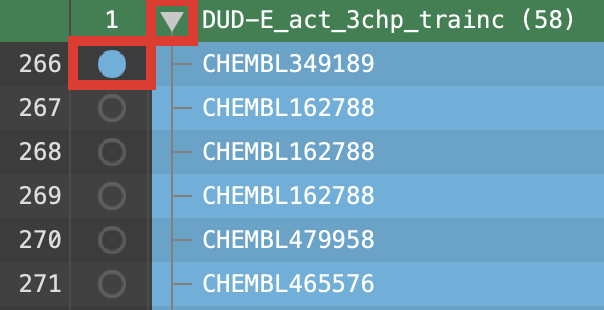
Figure 6-1. Group selection with the first entry included.
Clear the Workspace
Select the group DUD-E_act_3chp_trainc and drop down the list
Include the first entry, CHEMBL349189
Note: Use Window > 2D Viewer to see a 2D tiled view of all selected ligands
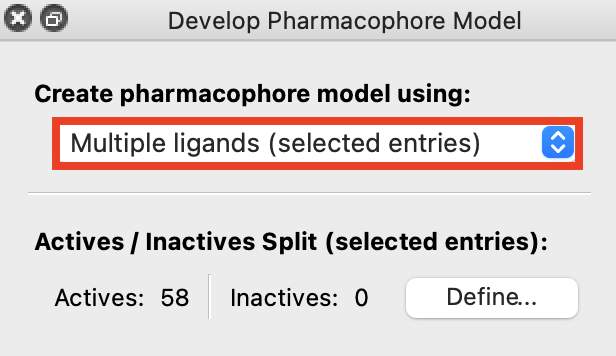
Figure 6-2. Creating a pharmacophore model from Multiple ligands (selected entries).
Go to Tasks> Ligand Based Virtual Screening> Develop Pharmacophore Hypothesis
Under Create pharmacophore model using, choose Multiple ligands (selected entries)
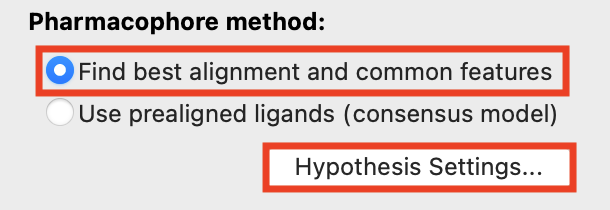
Figure 6-3. Find best alignment option.
Under Pharmacophore method, choose Find best alignment and common features
Click Hypothesis Settings
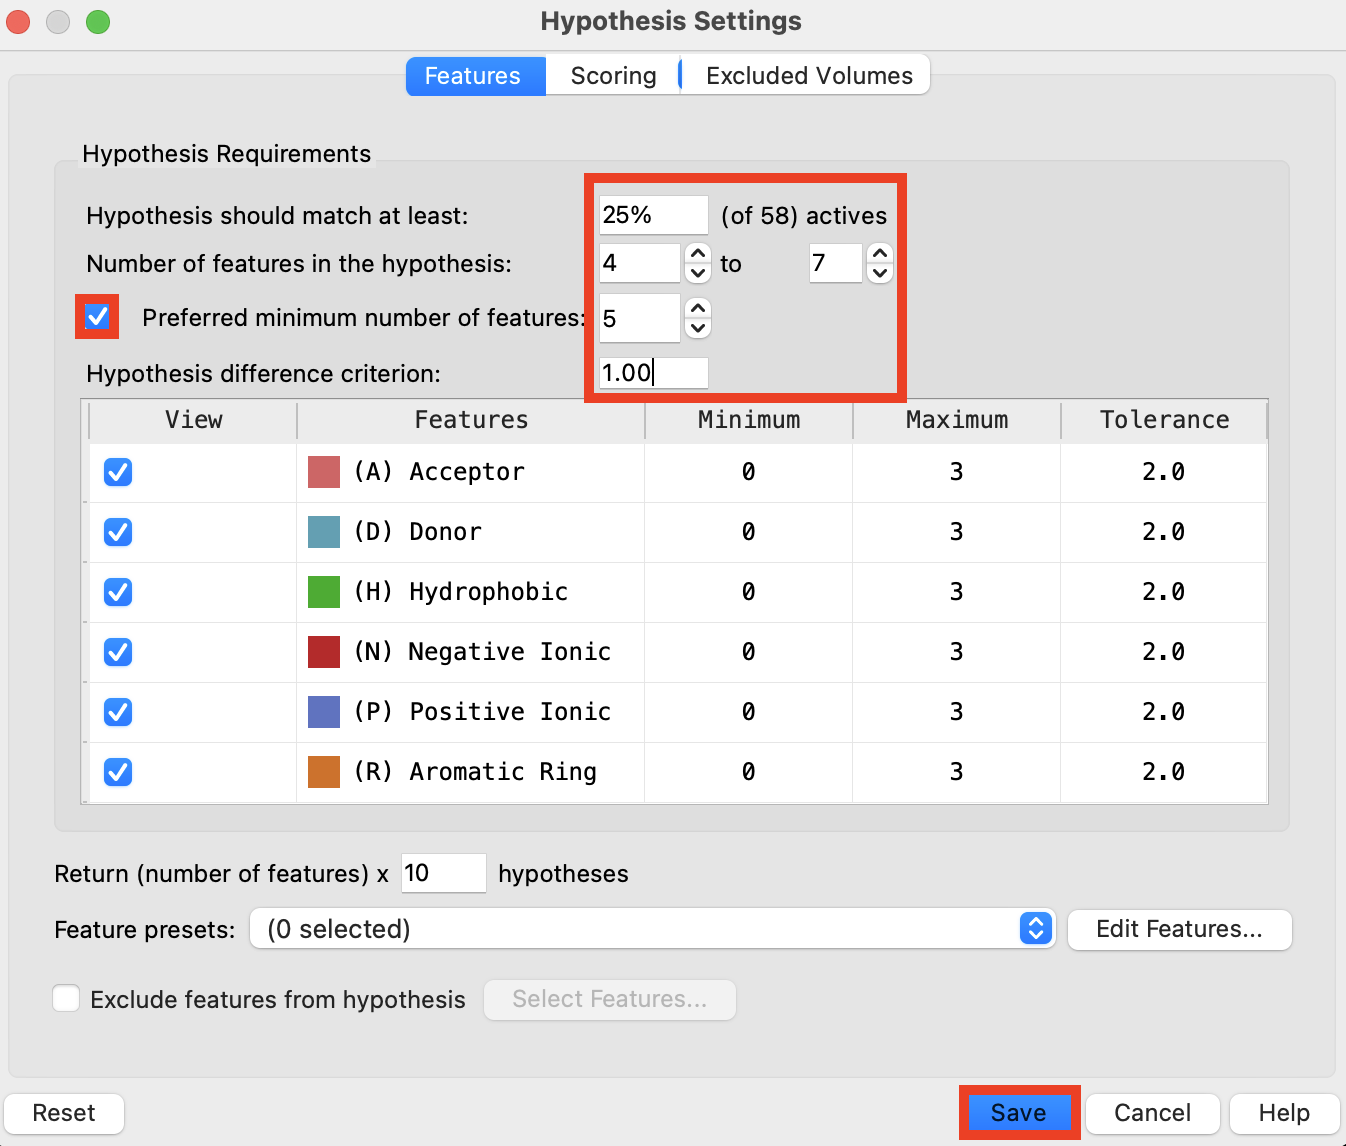
Figure 6-4. Hypothesis Settings Panel.
- In the Features tab, set Hypothesis should match at least 25% of actives
- In this tutorial, we assume that ligands without IC50 values were obtained from experiments. While they are all active, they may bind to different targets. Therefore, we decreased the percentage to accommodate a wider range of targets.
- Set Number of features in the hypothesis to 4 to 7
- Increase the range appropriately
- Check Preferred minimum number of features and set to 5
- Set the value between 4 and 7
- Set Hypothesis difference criterion to 1.00
- Increase the value to merge the similar hypotheses
- Click Save
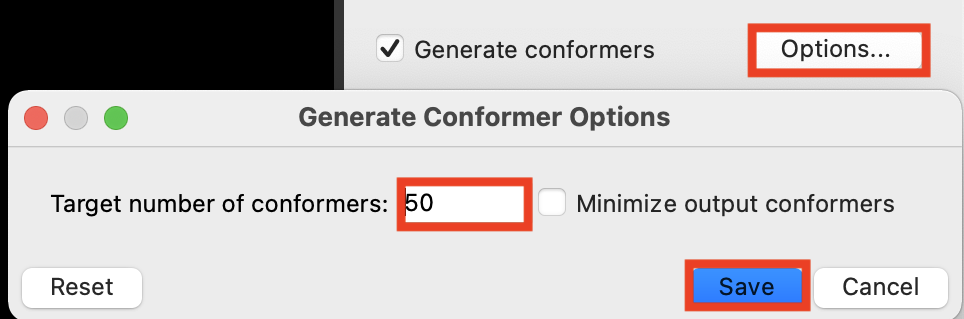
Figure 6-5. Generate Conformer Options panel.
Check Generate conformers
Click Options
Set Target number of conformers to 50
Click Save
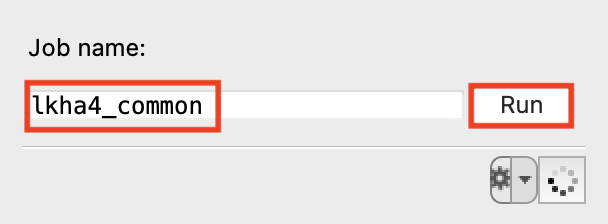
Figure 6-6. Change Job name.
Change Job name to lkha4_common
Click Run
Note: To save time, we will look at pregenerated results
6.2 View results from common pharmacophore hypotheses detection
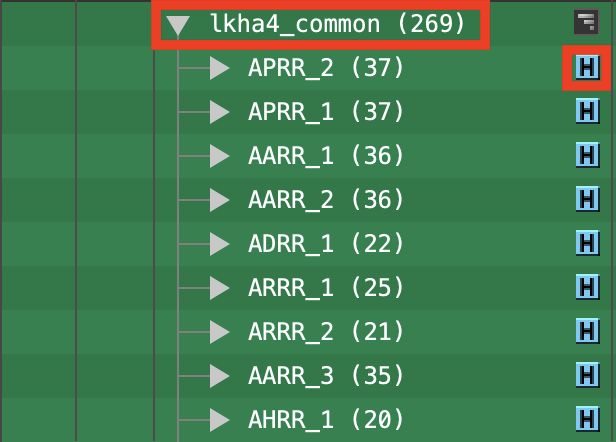
Figure 6-7. Expand the lkha4_common group.
Select lkha4_common and expand the group
Double-click the blue H next to the entries to view each hypothesis
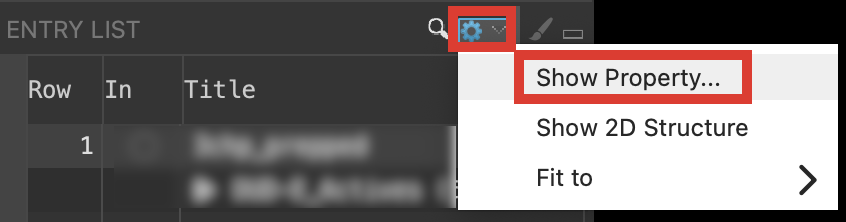
Figure 6-8. Show property option in the Entry List.
At the top right corner of the Entry List, click the Settings button (cog)
Choose Show Property
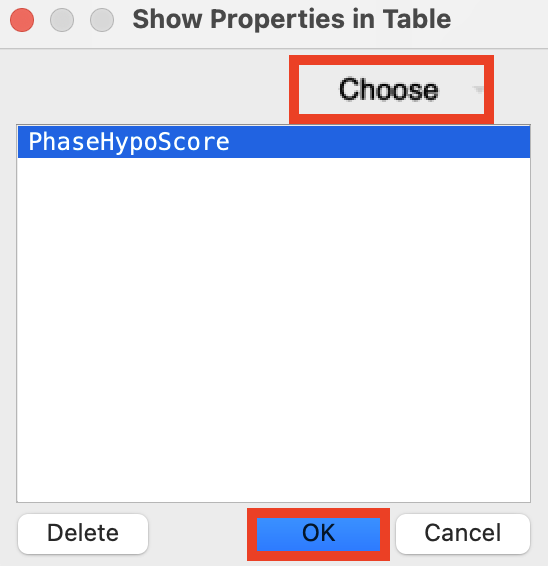
Figure 6-9. Show Property panel.
Click Choose
Type Hypo
Select PhaseHypo Score
Click OK
Note: The PhaseHypoScore is a linear sum of how well active ligands match the hypothesis and the hypothesis performance in a small-scale virtual screen using the known actives and 1000 compound Glide decoy set. Larger values of PhaseHypoScore indicate the hypothesis is more likely to perform well in virtual screening
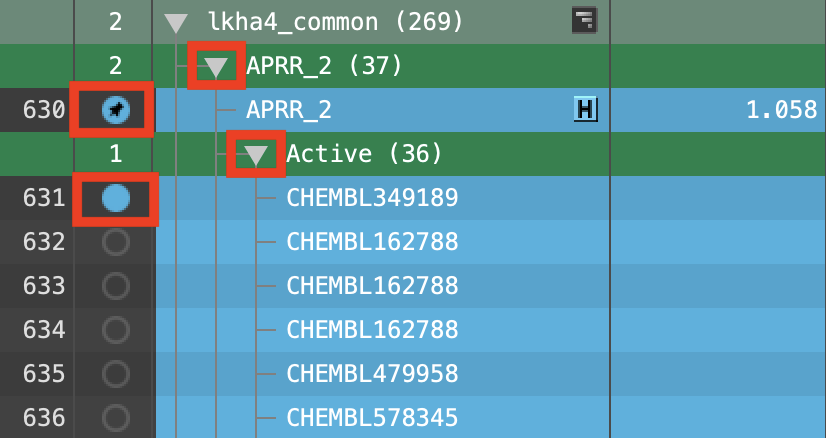
Figure 6-10. Include the active ligands of top-ranked hypothesis (fixed) in the Workspace.
Expand APRR_2
Double-click the APRR_2 In circle to fix the hypothesis in the Workspace
Select and expand the Active (36) group
Include the first entry
Use right and left arrow keys to step through the entries
6.3 Examine multiple binding modes in common pharmacophore results
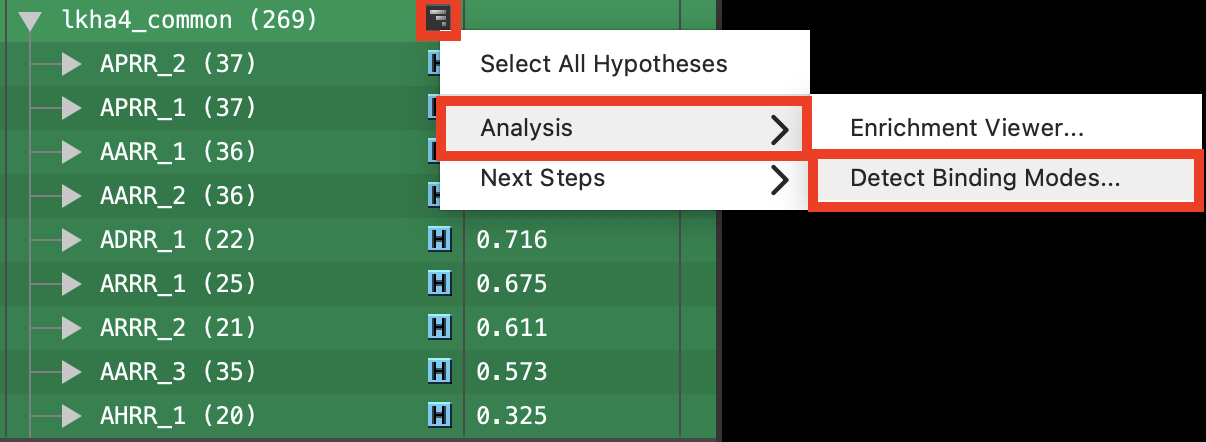
Figure 6-11. Detect binding modes option for lkha4_common hypotheses.
Collapse APRR_2 and select the lkha4_common group
Next to lkha4_common, click the symbol
Choose Analysis> Detect binding modes
- The Detect Binding Modes panel opens
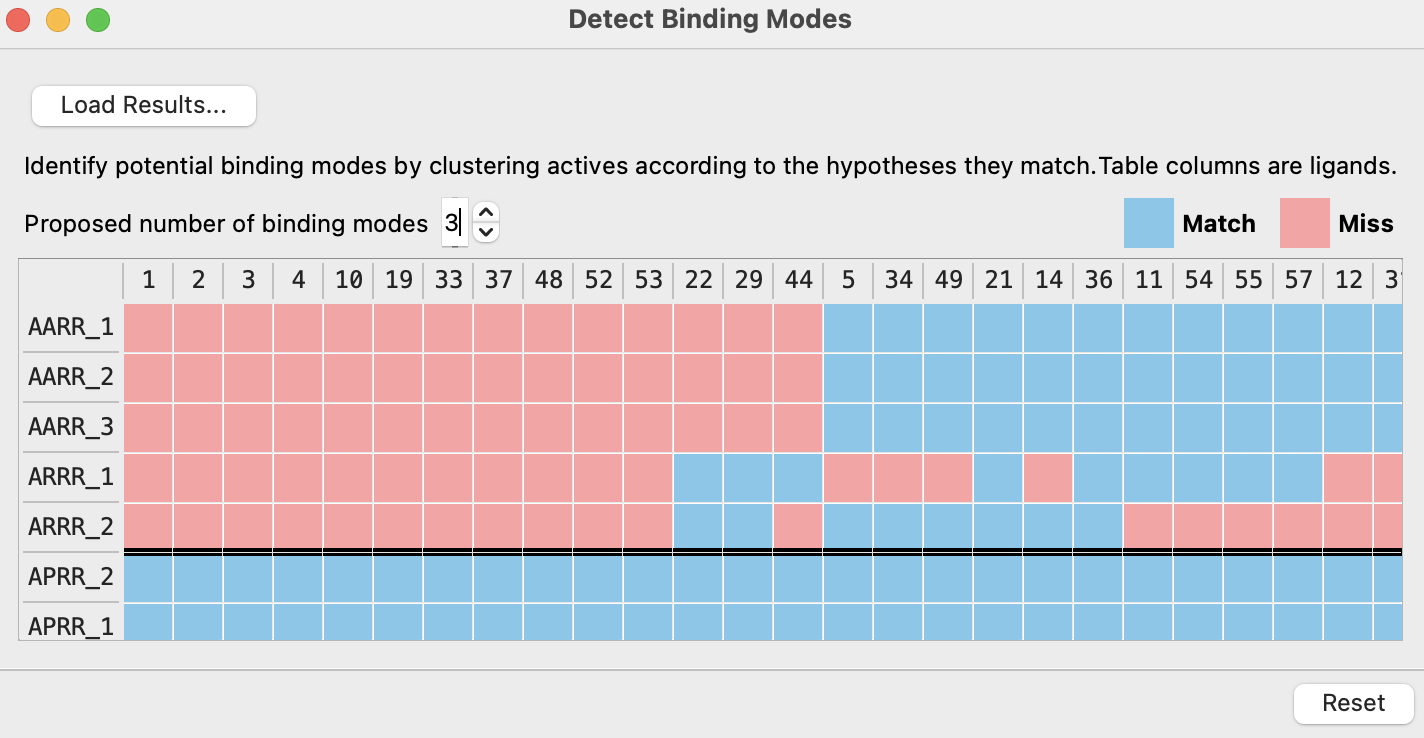
Figure 6-12. Detecting Binding Modes table with three proposed binding modes.
- Set Proposed number of binding modes to 3
- Ligands and hypotheses are clustered into binding modes
7 Conclusions
In this tutorial, we learned how to create pharmacophore hypotheses from a set of congeneric ligands with known experimental binding affinities. Additionally, we created a new Phase database from a set of ligands. We then screened that Phase Database against three of the generated pharmacophore hypotheses, and examined their PhaseScreenScores and Matched Ligand Sites. Finally, we generated pharmacophore hypotheses from a diverse ligand set, evaluated them with PhaseHypoScore and visualized the binding modes.
References
[1] Ligand-Based Virtual Screening Using Phase (schrodinger.com)